Network observability is an optional operator for Red Hat OpenShift web console for insight into your network traffic and help with troubleshooting. With release 1.12, it aligns with Red Hat OpenShift Container Platform 4.22 and is backwards-compatible to 4.14.
At its core, network observability uses extended Berkeley packet filter (eBPF) agent to collect and aggregate network flow data. A flowlogs-pipeline (FLP) component processes and enriches the data with Kubernetes metadata, such as its pod name and namespace. They are stored as Loki logs and Prometheus metrics. When you install the operator, it adds a UI plug-in to OpenShift to provide visualization in the form of graphs, a flow table, and a topology view.
To try out the features in this version, you need an OpenShift cluster and access to the oc command. Start by following the instructions to install the network observability operator. For an overview of features and the list of issues fixed, see the release notes.
There is an upstream version, but this article focuses on using Red Hat OpenShift, including:
- Security improvements
- TLS tracking
- Secure communications between eBPF agent and FLP
- Performance improvements
- Kafka compression
- FLP shared cache component
- Ease of use
- Automatic secondary network indexing
- Simplify adding predefined metrics
TLS tracking
Network observability supports a list of networking-related features configured at the eBPF level. Because a feature uses CPU and memory, you can pick and choose exactly which features to enable.
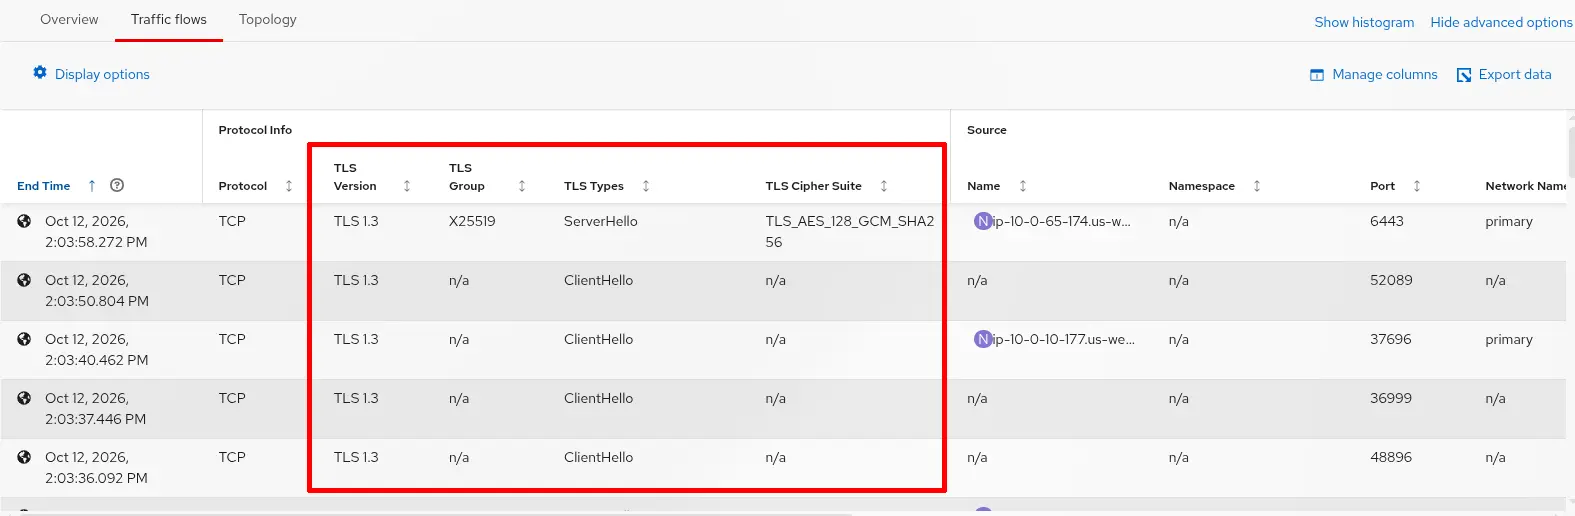
In 1.12, a new eBPF feature, TLS tracking, was added. It monitors TLS connections and records information such as the TLS version, cipher suite, cryptographic group (curve), and TLS type. A typical use of this feature is to ensure that your cluster is fully compliant with the organization's security policies. That might mean you only want TLS 1.3 in the network or you might want all traffic to be encrypted.
In the OpenShift web console, you can enable this feature when you create a FlowCollector instance. In Ecosystem > Installed Operators, click the FlowCollector link on the Network Observability row. On the second page of the setup in the Features section, enable TLSTracking.
Alternatively, enter oc edit flowcollector and add TLSTracking under the features section:
spec:
  agent:
    ebpf:
      features:
      - TLSTracking
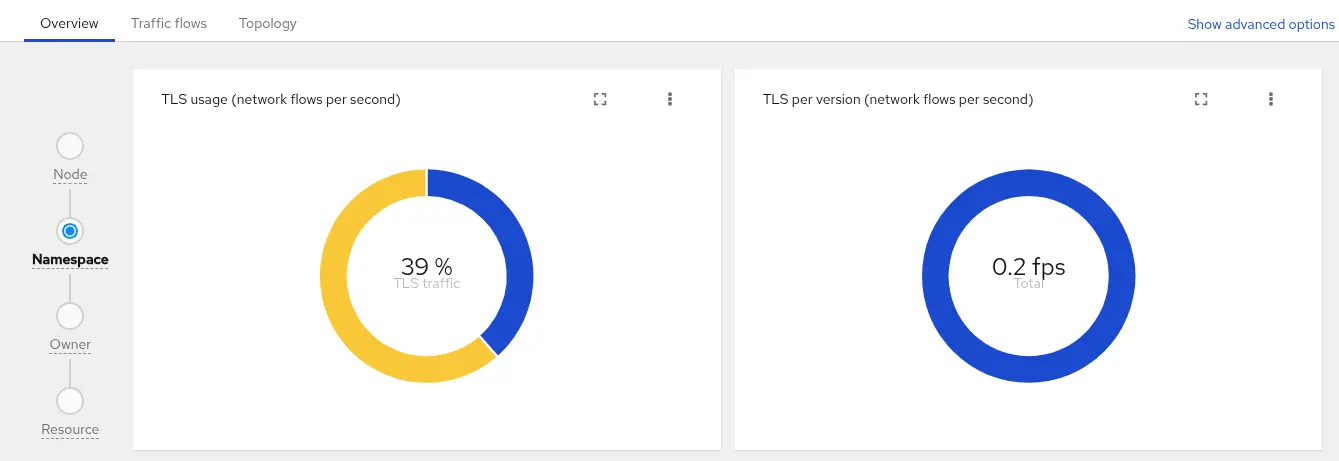
Once this is enabled, go to Observe > Network Traffic. In the Overview tab, there are new TLS graphs (figure 1).
In the Traffic flows tab, there are new columns for TLS in the table (figure 2). By default, only the TLS Version column is shown (may need to scroll to the right to see it). Click Show advanced options and then Manage columns. Enable the tls option to filter on the TLS-related columns.
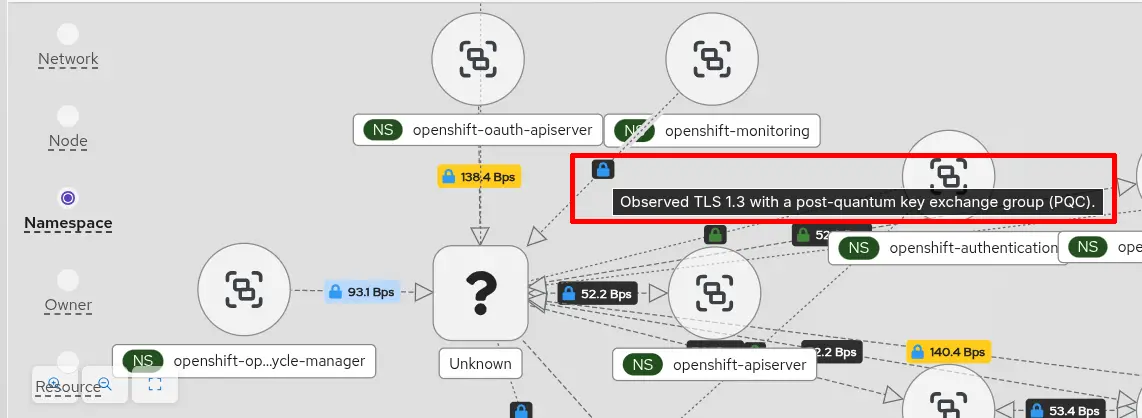
In the Topology tab, you can visualize what traffic is or is not using TLS (figure 3).
Secure communications between eBPF agent and flowlogs-pipeline
To enhance internal cluster security, network observability introduces a new TLS type parameter for configuring TLS or mutual TLS (mTLS) between the eBPF agents and the flowlogs-pipeline.
By default, this parameter is set to Auto, meaning it uses native OpenShift annotations to secure communication without requiring manual configuration. If this is sufficient for your requirements, then you don't need to do anything. Otherwise, set it to Disabled or use Provided to supply your own certificates.
Here's an example of setting a Provided configuration for custom certificates. Enter oc edit flowcollector to make these changes:
apiVersion: flows.netobserv.io/v1beta2
kind: FlowCollector
metadata:
  name: cluster
spec:
  processor:
    service:
      tlsType: Provided  # Other values: Auto (default), Disabled
      providedCertificates:
        # CA cert used to verify client and server certificates
        caFile:
          name: custom-ca-configmap
          type: configmap
          file: ca.crt
        # Certificate that FLP presents to the eBPF agent
        serverCert:
          name: flp-server-cert-secret
          type: secret
          certFile: tls.crt
          certKey: tls.key
        # Certificate that eBPF agent presents to FLP
        clientCert:
          name: agent-client-cert-secret
          type: secret
          certFile: tls.crt
          certKey: tls.key  #Omit if client key isn't required by setup
You can omit the certKey if the secret contains both the public certificate and private key.
Kafka compression
In network observability, Kafka is an optional component that buffers traffic flows generated by the eBPF agent for processing by FLP and is often needed in high-traffic environments. The supported version from Red Hat is Streams for Apache Kafka. In this release, Kafka performance is improved through compression, with support for gzip, Snappy, LZ4, and Zstandard (zstd).
Assuming you already have Kafka configured, enable Kafka compression in FLP by entering oc edit flowcollector and making these changes:
spec:
  deploymentModel: Kafka
  kafka:
    compression: gzip
FLP can also export flow data to Kafka consumers, with support for compressing the exported data. To do this, edit as follows:
spec:
  exporters:
  - kafka:
      compression: gzip
    type: Kafka  # make sure this is capitalized
FLP shared cache component
In large environments, you might notice that your API server (kube-apiserver) gets slower when network observability is started. This is because FLP sends a sudden burst of list and watch requests to the API server while booting up. By introducing a shared cache component for these requests, it drastically flattens these boot-up spikes. This ensures a much smoother deployment and restart cycle without overwhelming the cluster's control plane.
Automatic secondary network indexing
Red Hat OpenShift supports secondary networks through the Multus CNI. Secondary networks are commonly used with SR-IOV or with OVN-Kubernetes' user-defined networks (UDN) and allows a pod to have multiple interfaces.
Ideally, the packets that go through the secondary interfaces on these networks should also be enriched to identify the pod name, network name, and namespace. Prior to 1.12, FLP created a lookup table for these pods only if it matched a network name specified in the secondaryNetworks section of your FLP configuration (for example, test-network-1 and test-network-2 in the listing below). For each index defined, it creates a lookup table. On lookup, the MAC lookup table has preference over IP if both are defined.
spec:
  agent:
    ebpf:
      privileged: true  # required to access secondary interfaces data
  processor:
    advanced:
      secondaryNetworks:
        - index:
          - IP
          - MAC
          name: test-network-1  # deprecated and ignored in 1.12
        - index:
          - MAC
          name: test-network-2  # deprecated and ignored in 1.12
In 1.12, this is simplified by not requiring you to provide the list of network names and keep them up-to-date. It will automatically index all secondary networks. While the configuration still accepts the name statement, it is deprecated and ignored. All of the index is combined and applied. If you don't define secondaryNetworks, then it defaults to MAC and IP for the index.
Simplify adding predefined metrics
There is a list of predefined metrics that network observability makes available in Observe > Metrics by default. The Prometheus metric name is prefixed with netobserv_ so, for example, the metric namespace_egress_bytes_total is netobserv_namespace_egress_bytes_total in Observe > Metrics.
Not all predefined metrics are available as Prometheus metrics, so you can include others. If you use includeList to do this, it overrides the list of predefined available metrics. In 1.12, use additionalIncludeList instead of includeList to add to the list instead of replacing it.
spec:
  processor:
    metrics:
      additionalIncludeList:  # use this instead of 'includeList'
        - namespace_egress_bytes_total
        - namespace_ingress_bytes_total
Conclusion
Network observability 1.12 delivers significant enhancements for performance, usability, and encryption to streamline Red Hat OpenShift cluster monitoring. Several maintenance releases have come out, so make sure you update to the latest. As usual, you can contact us on the discussion board.
Special thanks to Joel Takvorian and Mark Schmitt for reviewing this article.

