Every write any workload makes to a Kubernetes cluster ends up in the same place: etcd's write-ahead log, and then its backend, and then eventually its compaction cycle. On a hosted control plane, that pressure is concentrated, and the control plane is a set of pods on a management cluster, while etcd is the component that decides how well it holds up under load. Much of that pressure comes from objects nothing reads. Event objects are high-volume and short-lived, and almost entirely diagnostic. Yet they compete for exactly the same WAL fsyncs, backend commits, and compaction passes as the Deployments and Secrets that actually define a cluster. A single misbehaving controller or a few thousand crashlooping pods can push enough events through etcd to slow down everything else.
The etcd sharding feature, now in tech preview for hosted control planes, splits etcd into more than 1 instance and routes resources to a shard by kind. We tested the simplest useful configuration: 2 shards, with a main shard holding cluster state, and a dedicated events shard. This article reveals what we measured.
The results
The short version is that under event pressure, sharding is a clear win. There are up to 96% fewer slow applies, materially faster compaction, and more total write throughput, with no regression in pod latency or workload completion time. It costs roughly 1.8 to 2.3x the etcd container memory, and there's only 1 scenario (filling the database with large custom resources) where it is measurably worse.
Test environment
Both tests ran on identical hardware in AWS us-west-2, on the same Red Hat OpenShift 4.21 build, with the hosted control planes managed by HyperShift. The only variable was the etcd topology.
- Management cluster: Self-managed OpenShift 4.21, with 3 control plane and 3 worker (m6i.xlarge, 4 vCPU / 16 GiB) and 3 infra (r5.xlarge, 4 vCPU / 32 GiB) running the monitoring stack
- Hosted cluster: 24 worker nodes (m5.xlarge, 4 vCPU / 16 GiB)
- Storage and network: EBS-only instances, up to 10 Gbps network, up to 4.75–10 Gbps EBS bandwidth
- Standard arm: 1 etcd instance for the whole hosted control plane
- Sharded arm: 2 etcd instances, with a main shard (cluster state) and events shard
- Samples: 3 runs per arm per workload
4 workload variants were run against each arm. Each leans on a different part of the etcd write path, and they were chosen because they map to failure modes we have actually seen in the field rather than because they produce flattering graphs.
Caution
All figures in this article come from 3 runs per arm per workload. The values shown are from 1 representative run. Percentage changes are stated consistently as change relative to the standard arm, using the main shard (the busier of the 2) as the sharded value. Results are from a tech preview feature, and are not capacity-planning guidance.
How the workloads were driven
All 4 variants ship in kube-burner-ocp under the etcd-density workload, which is the wrapper around kube-burner that the OpenShift Performance and Scale team uses for all of its control-plane testing — so none of this is lab-only. Flags and defaults for each variant are documented in the etcd-density reference. Every run used QPS/Burst of 20/40 and garbage collection at the end, and we verified that the hosted cluster was healthy before starting.
kube-burner-ocp etcd-density event-storm \
  --iterations=900 --event-iterations=2000 --event-replicas=100 \
  --storm-workers=20 --gc=true

kube-burner-ocp etcd-density crashloop-flood \
  --iterations 20 --crashloop-replicas 2000 --soak-duration 10m --gc=true

kube-burner-ocp etcd-density db-quota-pressure \
  --iterations 4500 --kb-chunks 8 --kb-size 100 --gc=true

kube-burner-ocp etcd-density annotation-churn \
  --patch-replicas 50 --patch-rounds 100 --iterations 10 --gc=true
Event storm: 200,000 events while real work is happening
The event-storm variant creates 200,000 synthetic ~1 KiB Event objects across 20 parallel workers. While that storm is running, a victim workload deploys 900 iterations of 2 Deployments (2 pause-image replicas each), 3 ConfigMaps, and a Service. The point is not to see how fast we can write events, it's to see what the storm does to ordinary cluster operations happening alongside it.
The split works
First, we check whether resources are actually landing in the expected shard. They are, and the 2 shards together absorb more work than the single instance managed (see Figure 1).
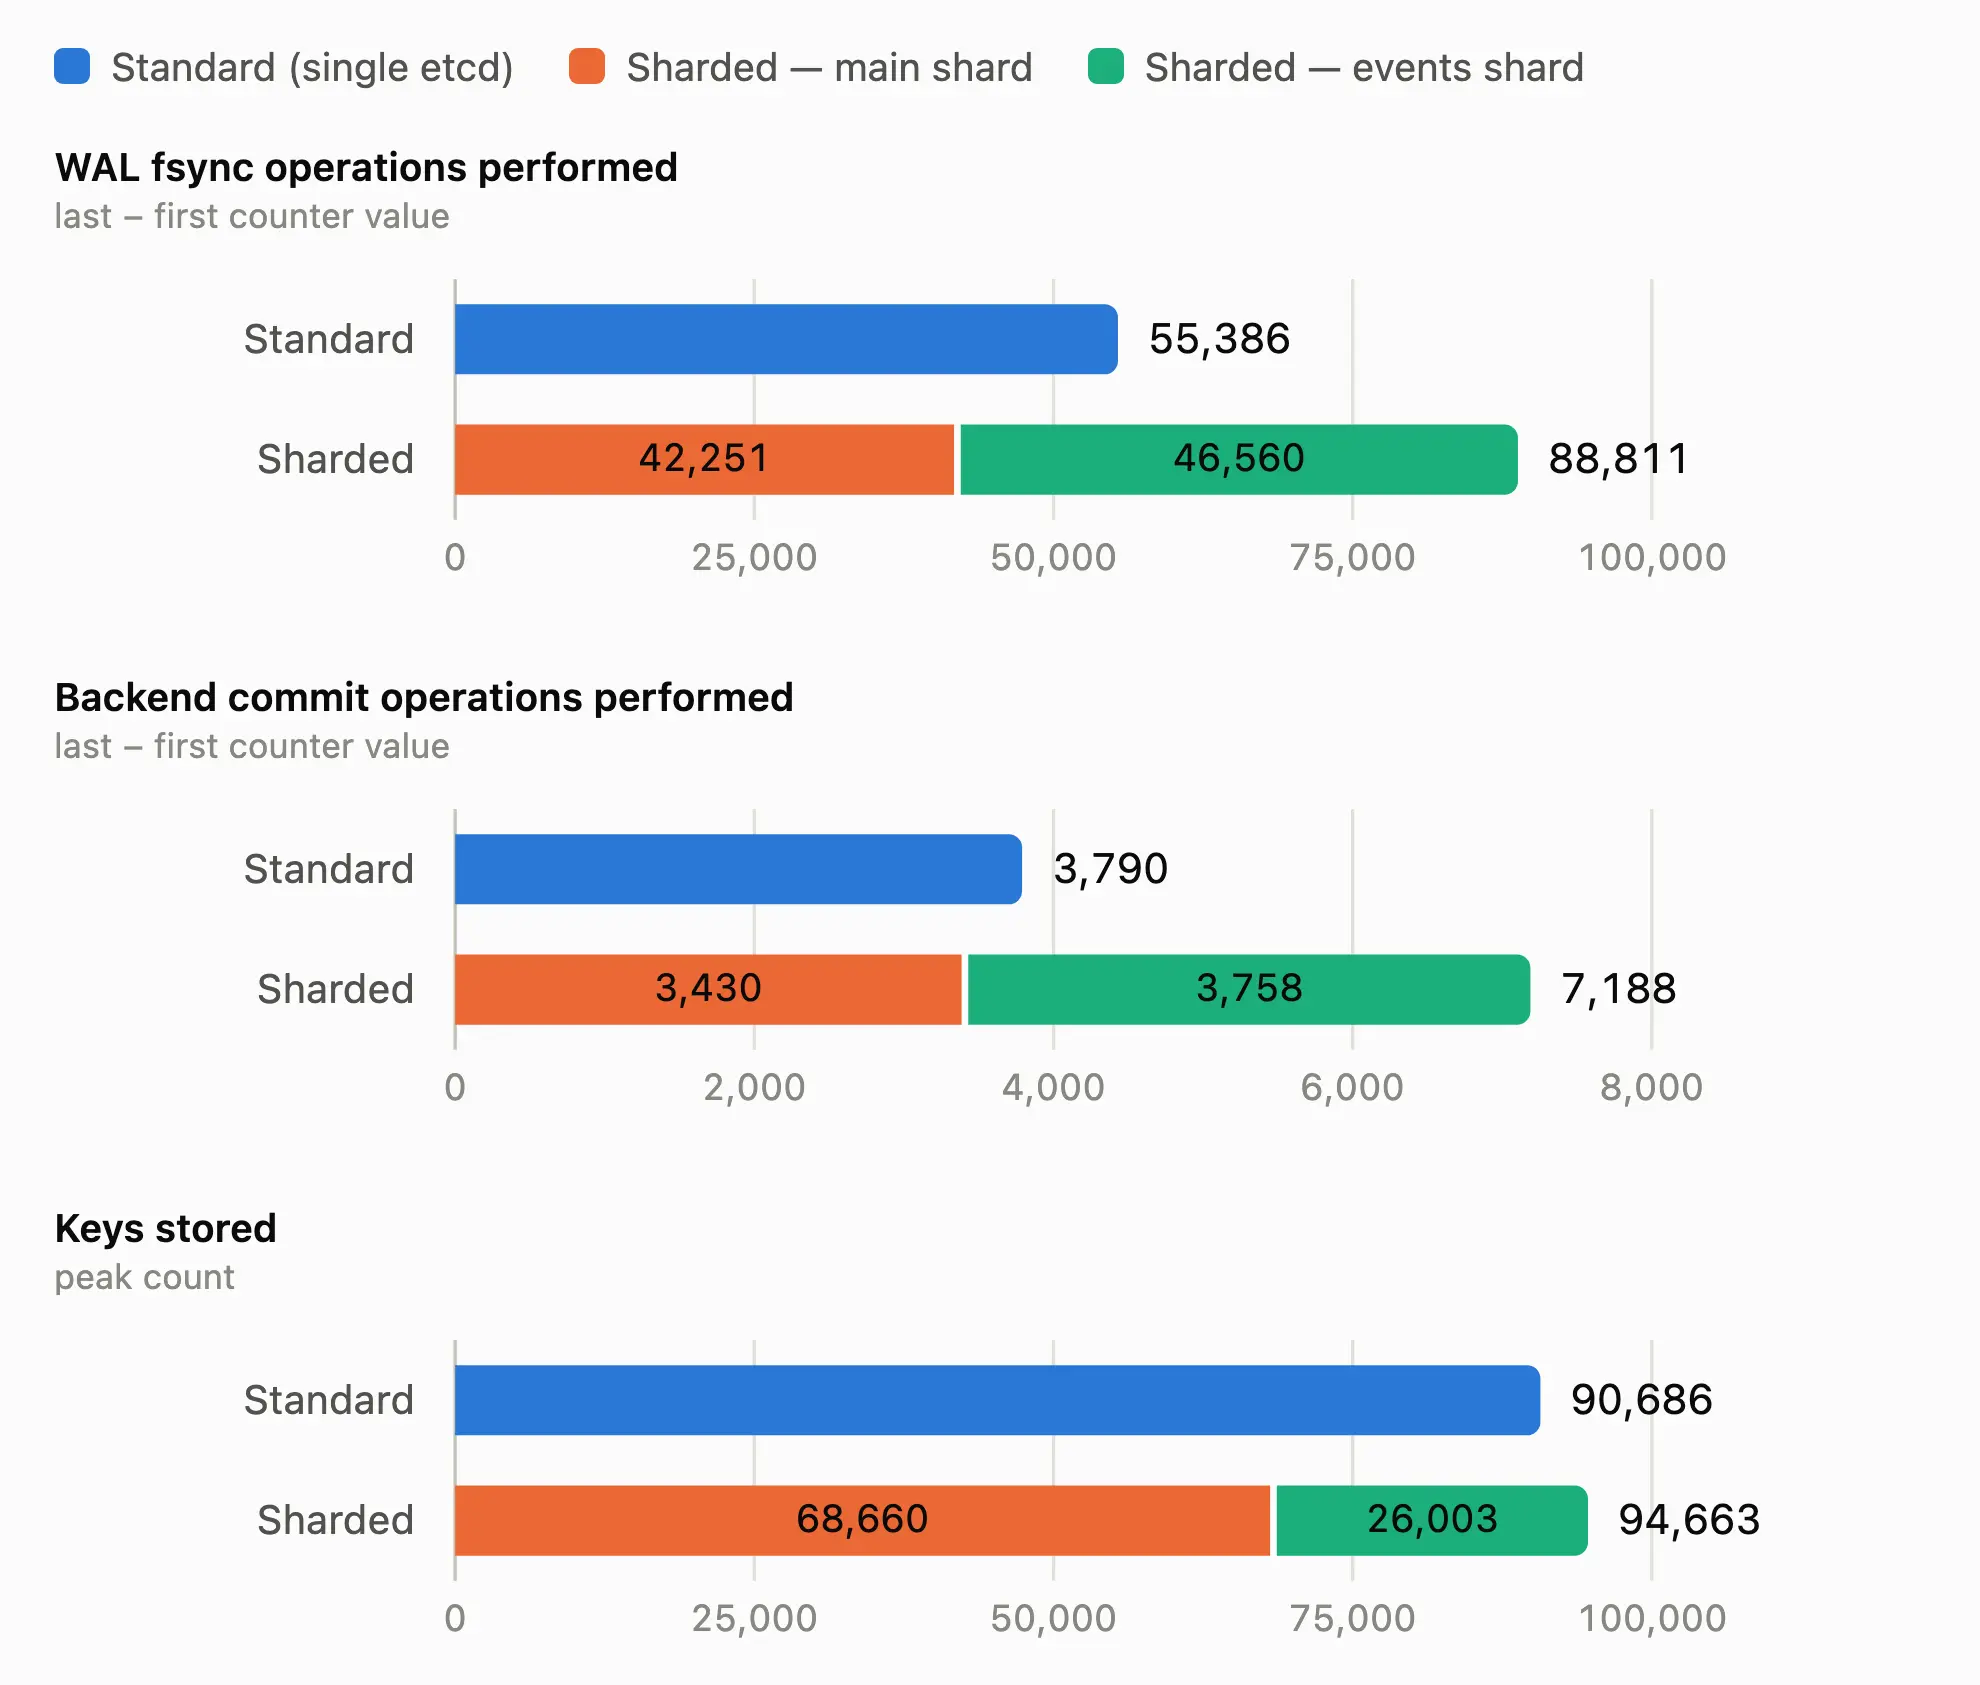
About 26,000 keys move to the events shard. On throughput, it's important to note that etcd's WAL fsync and back-end commit metrics are cumulative counters. The reading at the end of a run does not reflect just the work that the run performed, because it includes everything the process had already done before the test started. The operations that were actually performed are the last value on the panel minus the first, and that is what we report here.
On that basis, the standard arm performed 55,386 WAL fsyncs (the counter moved from 20,355 to 75,741). The sharded arm performed 42,251 on the main shard (13,484 to 55,735) and 46,560 on the events shard (8,412 to 54,972). That's 88,811 combined, or 60% more write operations pushed through for the same workload.
Back-end commits tell the same story, with 3,790 in the standard arm (4,100 to 7,890) against 3,430 on the main shard and 3,758 on the events shard. That's 7,188 combined, or 90% more. The system is not just redistributing work, it's getting more of it done.
Latency on the shard that matters
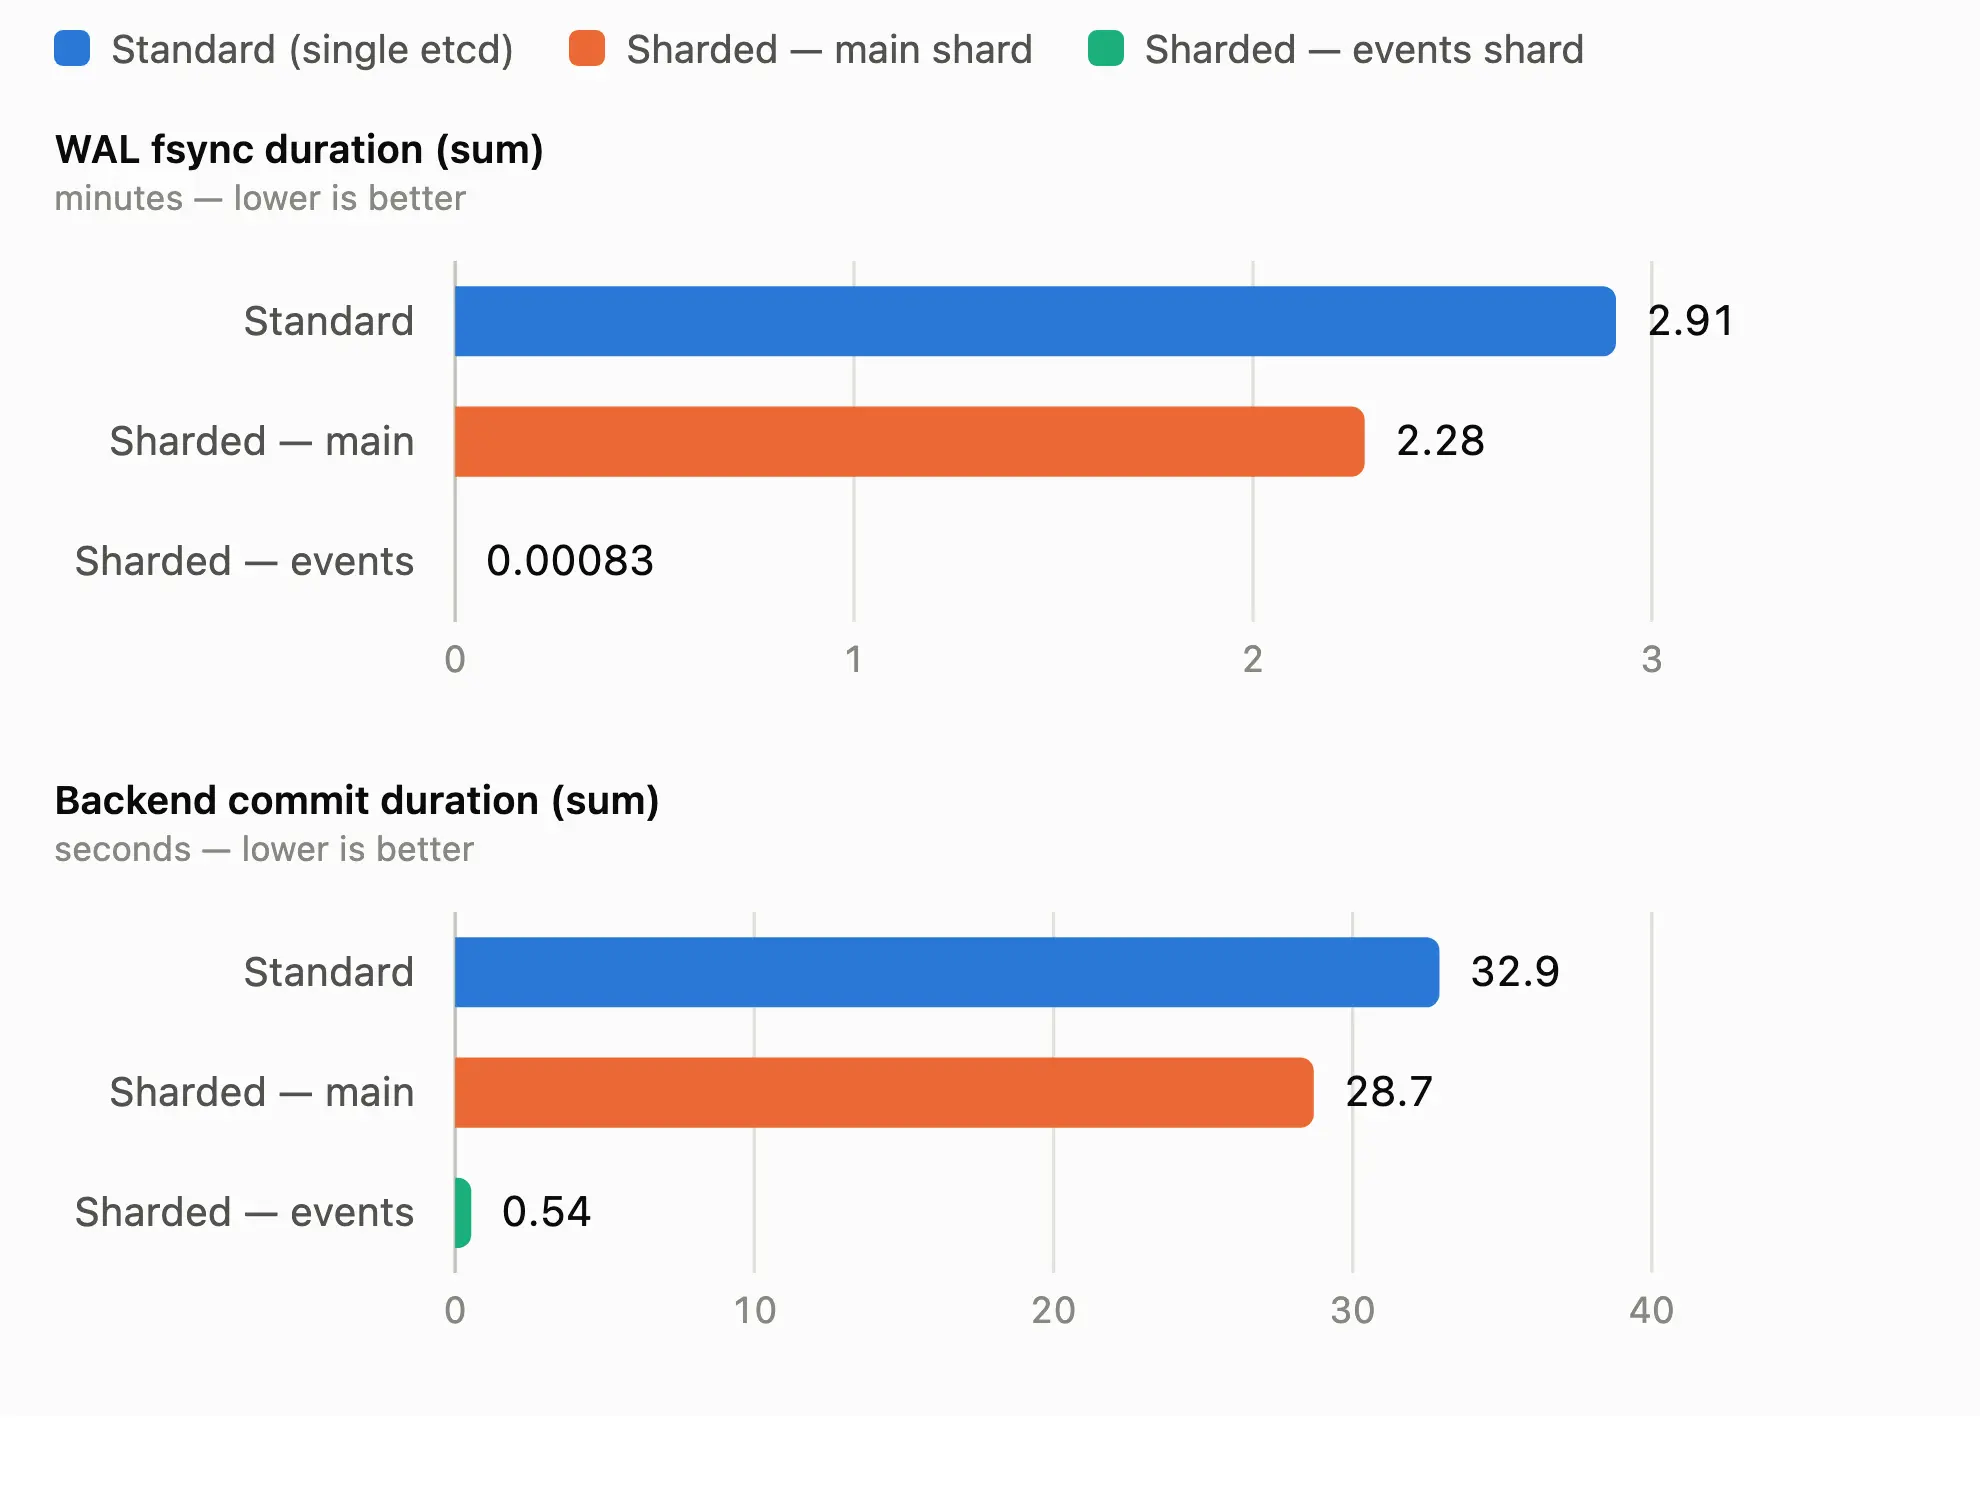
Throughput is only interesting if the shard holding your cluster state gets faster. It did, as shown in Figure 2.
Compaction is the standout. In the standard arm it runs in seconds; in the sharded arm the main shard is down to 597 ms and the events shard to 184 ms (see Figure 3).
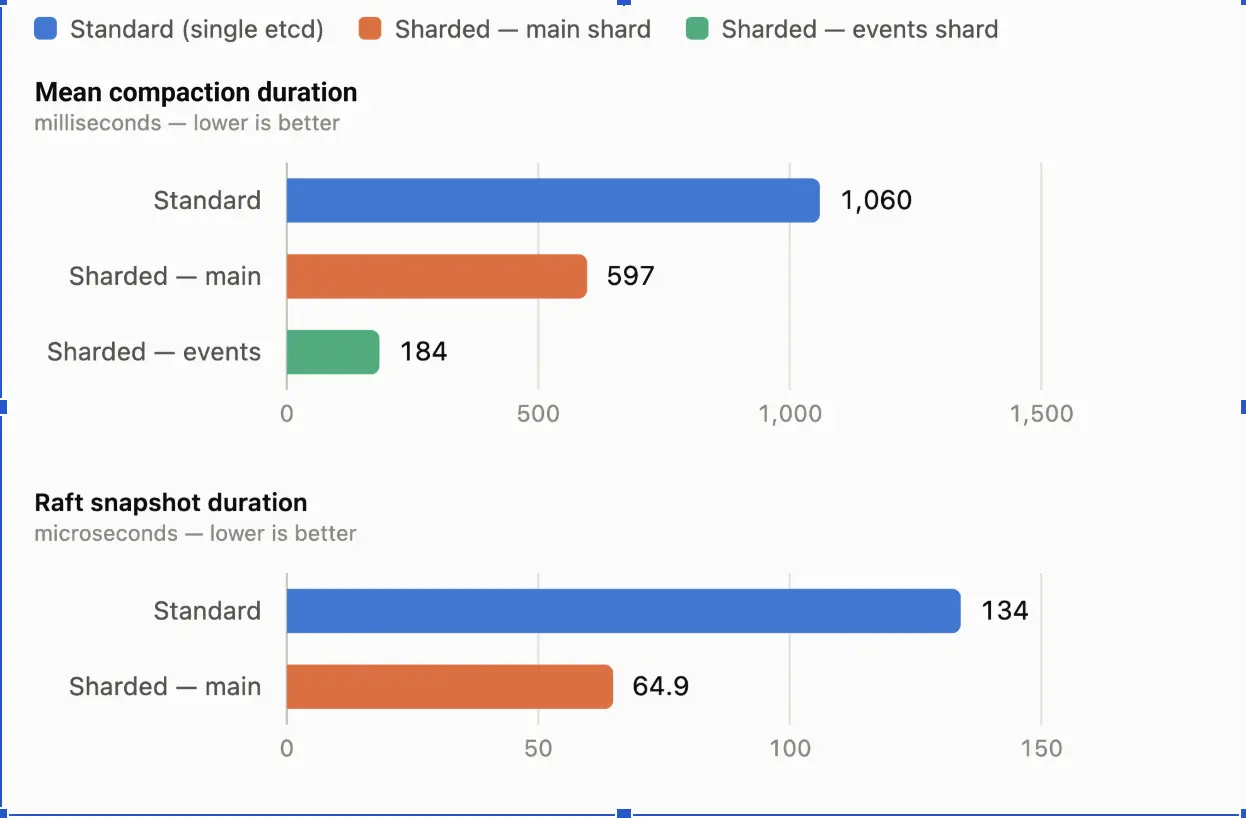
Faster compaction means the database reclaims logical space sooner, which in turn means defragmentation (a genuinely disruptive operation) needs to happen less often. Raft snapshot duration halving matters for a different reason: It's the window in which a failover loses data.
fsync duration, sum
- Standard: 2.91 min
- Main shard: 2.28 min
- Events shard: 49.8 ms
- Change: −21.6%
Back-end commit duration, sum
- Standard: 32.9 s
- Main shard: 28.7 s
- Events shard: 538 ms
- Change: −12.8%
Mean compaction duration
- Standard: 1.06 s
- Main shard: 597 ms
- Events shard: 184 ms
- Change: −43.7%
Raft snapshot duration
- Standard: 134 µs
- Main shard: 64.9 µs
- Events shard: —
- Change: −51.6%
Slow applies: The resilience result
Slow applies are etcd telling you that it couldn't keep up. This is the single clearest result in the whole set, as shown in Figure 4.
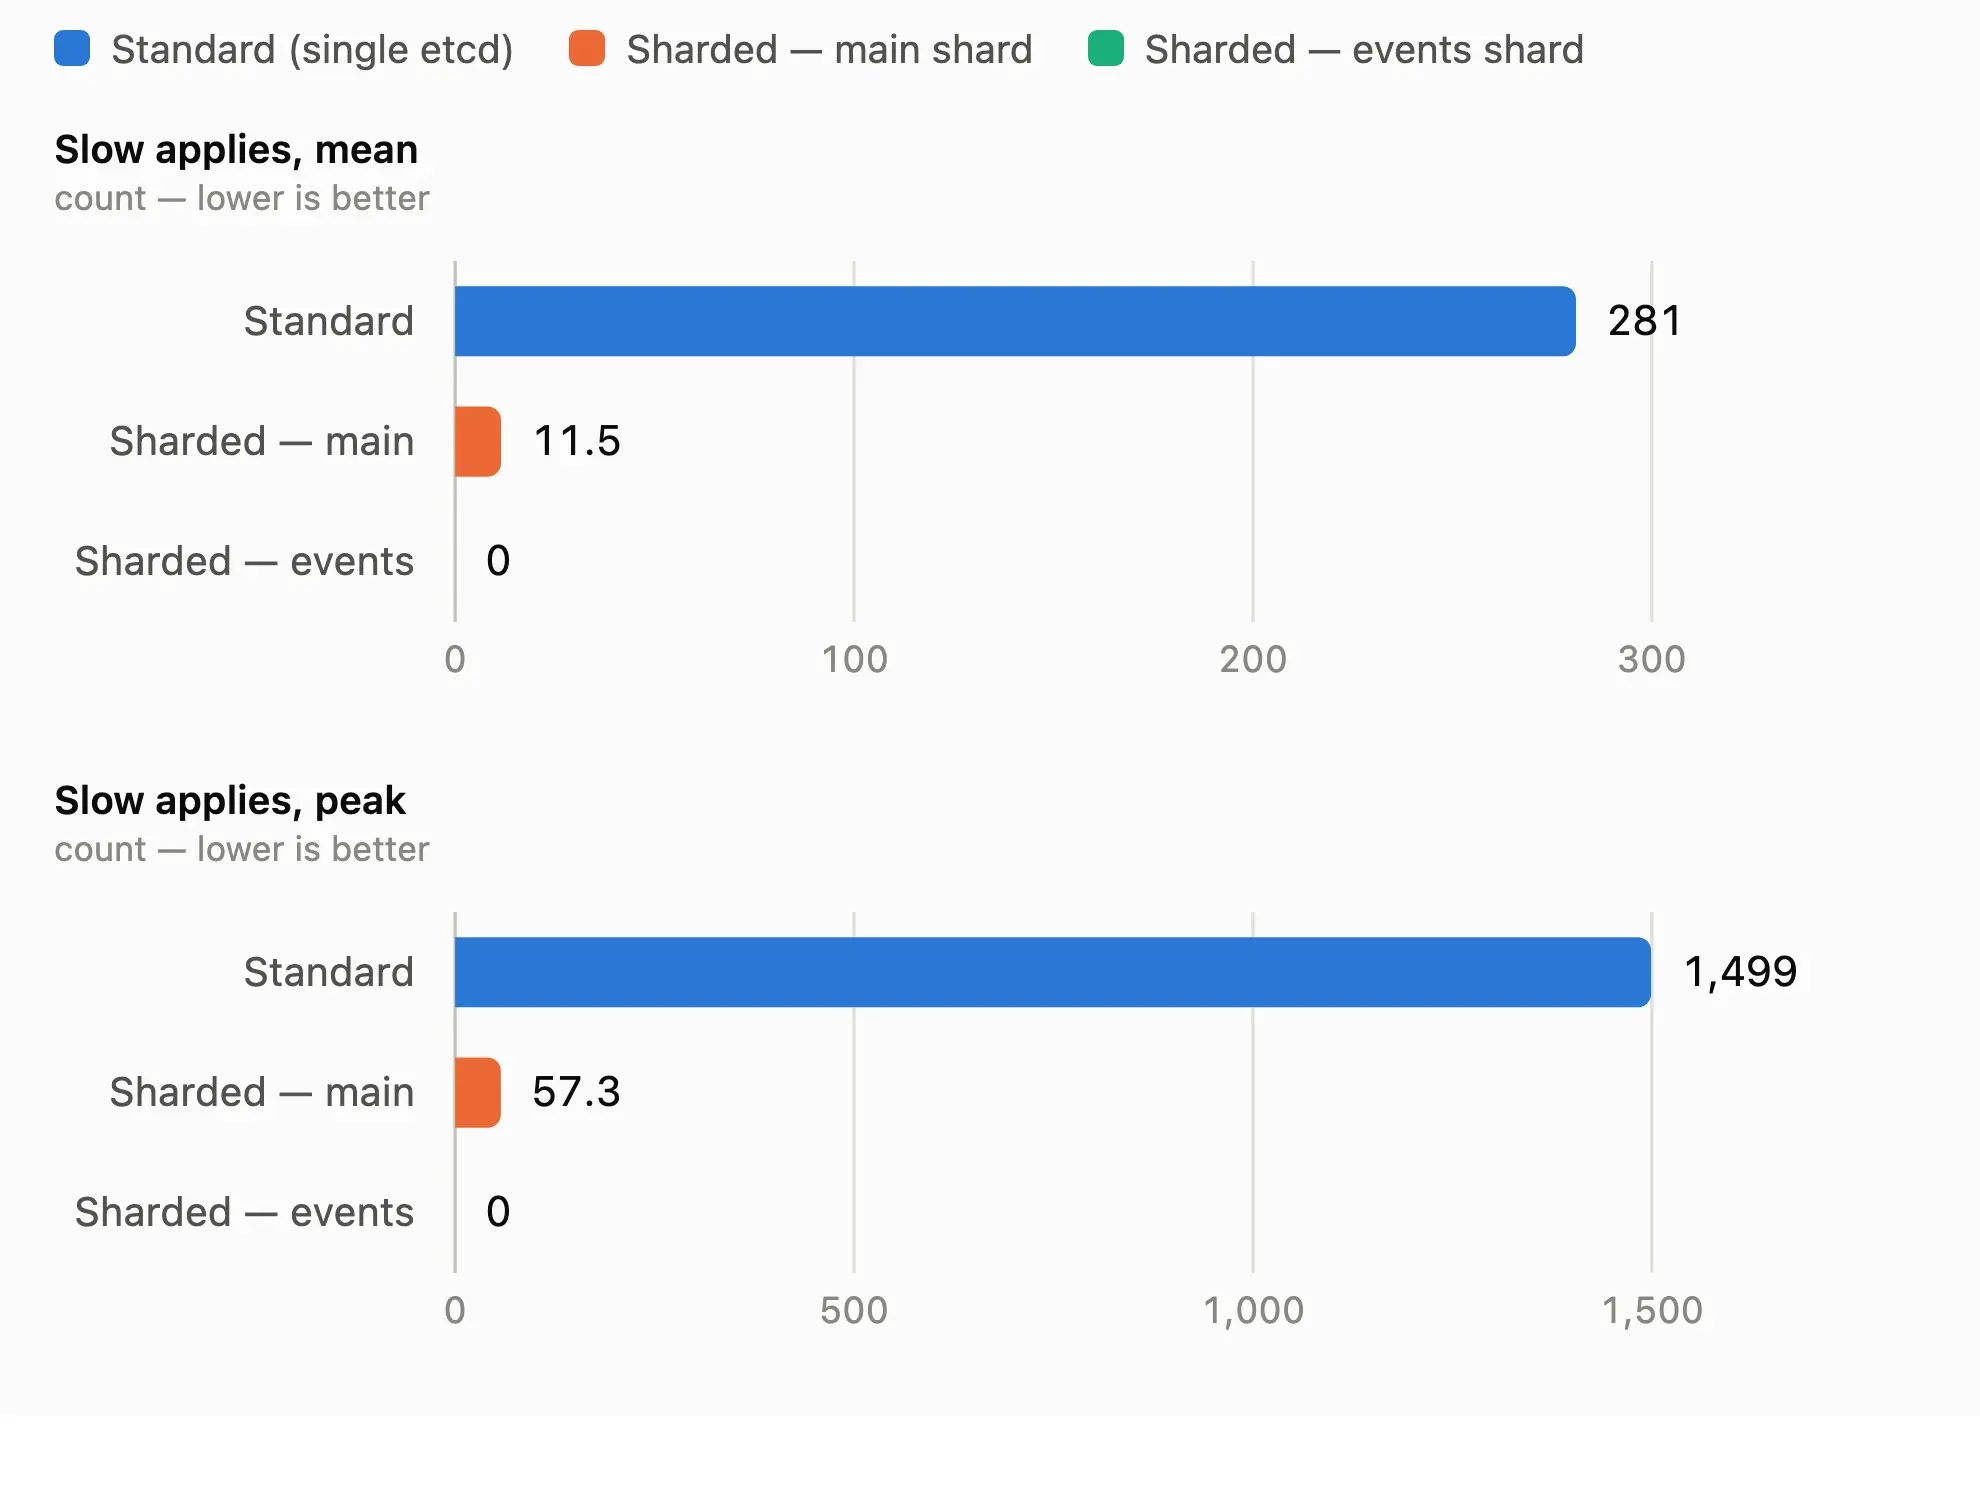
A mean of 281 and a peak of 1,499 slow applies in the standard arm, against 11.5 and 57.3 on the sharded main shard (a 96% reduction) and exactly 0 on the events shard. Slow read indexes were 0 in both arms.
Just as importantly, nothing regressed on the user-visible side. Pod-ready latencies were comparable and consistent across arms, and workload finish times were similar. The sharded arm finished about a minute earlier in one sample. The standard arm occasionally failed this workload outright. The sharded arm never did.
Crashlooping pods (the same test, but more realistic)
Synthetic events are a clean signal but an artificial one. Real event storms are dominated by kubelet, scheduler and controller events being written and rewritten, and crucially by PATCH operations that increment the count field on an existing event key rather than creating new ones. That is a different MVCC profile, and it's the pattern that shows up in real-world CI and build-farm clusters.
So the crashloop-flood variant runs 2,000 crashlooping pods across 20 namespaces. We used a ubi9-minimal container running exit 1 with restartPolicy: Always, generating about 6 events per crash cycle, plus a 10-minute soak after deployment. Figure 5 shows the results.
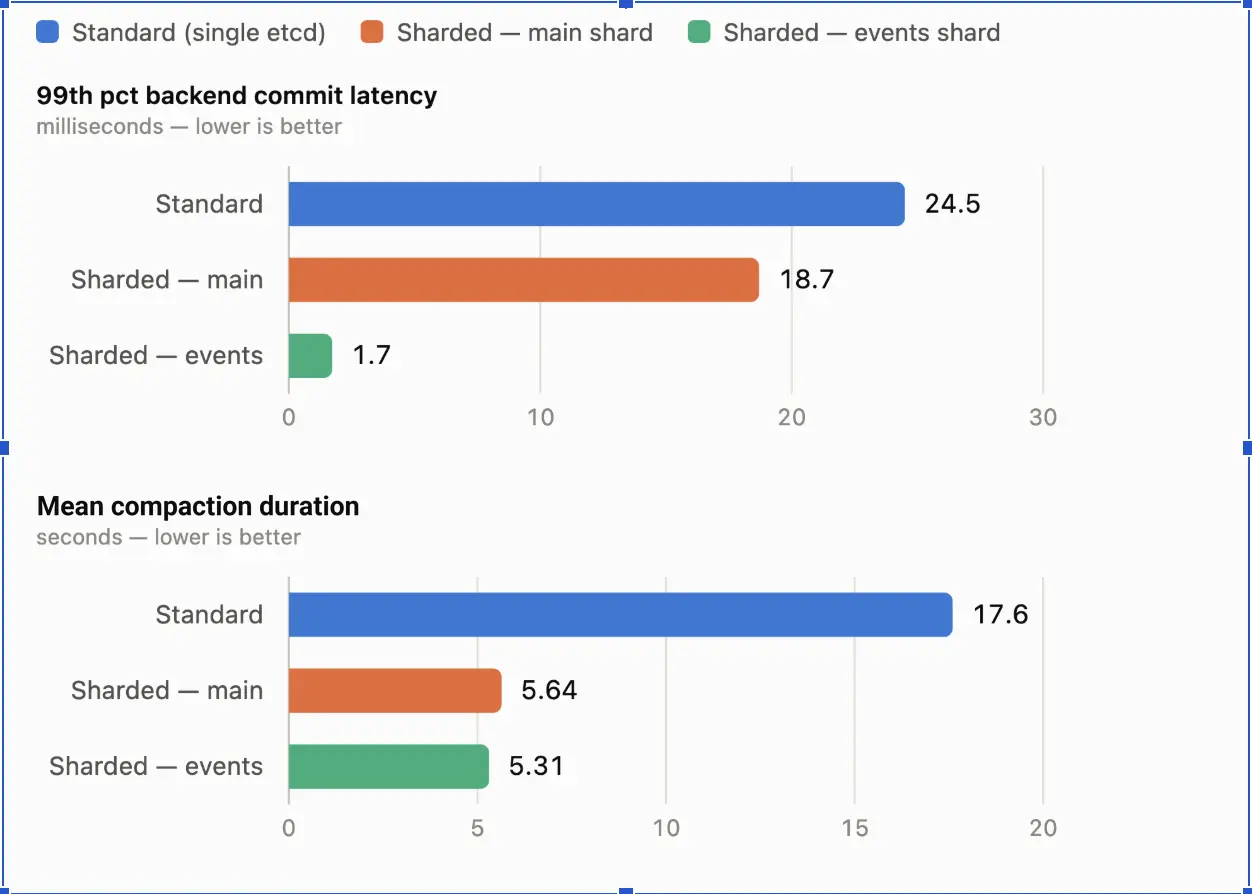
The conclusion from the synthetic test survives contact with the realistic one. Backend commit latency improves by roughly a quarter, compaction by more than two-thirds. WAL fsync and back-end commit throughput both improve, pending raft proposals stay lower, and the apply rate stayed at or above the commit rate throughout in both arms, meaning no write failures either way.
99th pct backend commit latency
- Standard: 24.5 ms
- Main shard: 18.7 ms
- Events shard: 1.72 ms
- Change: −23.7%
Mean compaction duration
- Standard: 17.6 s
- Main shard: 5.64 s
- Events shard: 5.31 s
- Change: −68.0%
Fragment size (end of run)
- Standard: 59.8 MiB
- Main shard: 55.9 MiB
- Events shard: 7.88 MiB
- Change: −6.5%
Fragment size (peak)
- Standard: 206 MiB
- Main shard: 160 MiB
- Events shard: 53.6 MiB
- Change: −22.3%
Keys stored (peak)
- Standard: 187,487
- Main shard: 148,197
- Events shard: 40,204
- Change: +0.5% combined
The fragment-size result is a quieter benefit worth calling out. Because each shard fragments independently, no single database accumulates as much free, but unreclaimed, space. Smaller fragments mean defragmentation is needed less often, and when etcd is busy we don't want defragmentations.
Annotation churn: Revision bloat on non-event objects
The annotation-churn variant rapidly merge-patches annotations on 500 ConfigMaps to build up hundreds of revisions per key, which is the update-storm pattern that controllers produce. The reason it is interesting for sharding is subtle. When events share a database with everything else, compaction has to process event revisions and annotation revisions in the same pass. Split them, and compaction on the main shard only has the revision bloat that actually matters.
Mean compaction duration
- Standard: 3.74 s
- Main shard: 2.25 s
- Events shard: 983 ms
- Change: −39.8%
Compaction growth rate
- Standard: 191 ms
- Main shard: 120 ms
- Events shard: 55.8 ms
- Change: −37.2%
Compacted keys (peak)
- Standard: 92,493
- Main shard: 92,093
- Events shard: 68
- Change: −0.4% combined
Slow operations
- Standard: 0
- Main shard: 0
- Events shard: 0
- Change: no change
Compaction lands about 40% faster, fragment sizes come out lower, and WAL fsync and backend commit latencies are essentially unchanged. Neither arm recorded a single slow operation. This is a modest, well-behaved win, which is generally what the theory predicted.
Sharding loses on DB quota pressure
We would not trust a set of results in which the new thing won every test. It did not.
The db-quota-pressure variant fills etcd with large custom resources (4,500 namespaces, each holding 8 100 KB objects, for around 3.5 GB in total) to see how sharding affects quota headroom. The hypothesis going in was favourable: If events are not consuming space in the main database, then there is more room for real cluster state. What we found instead was a regression in compaction (Figure 6).
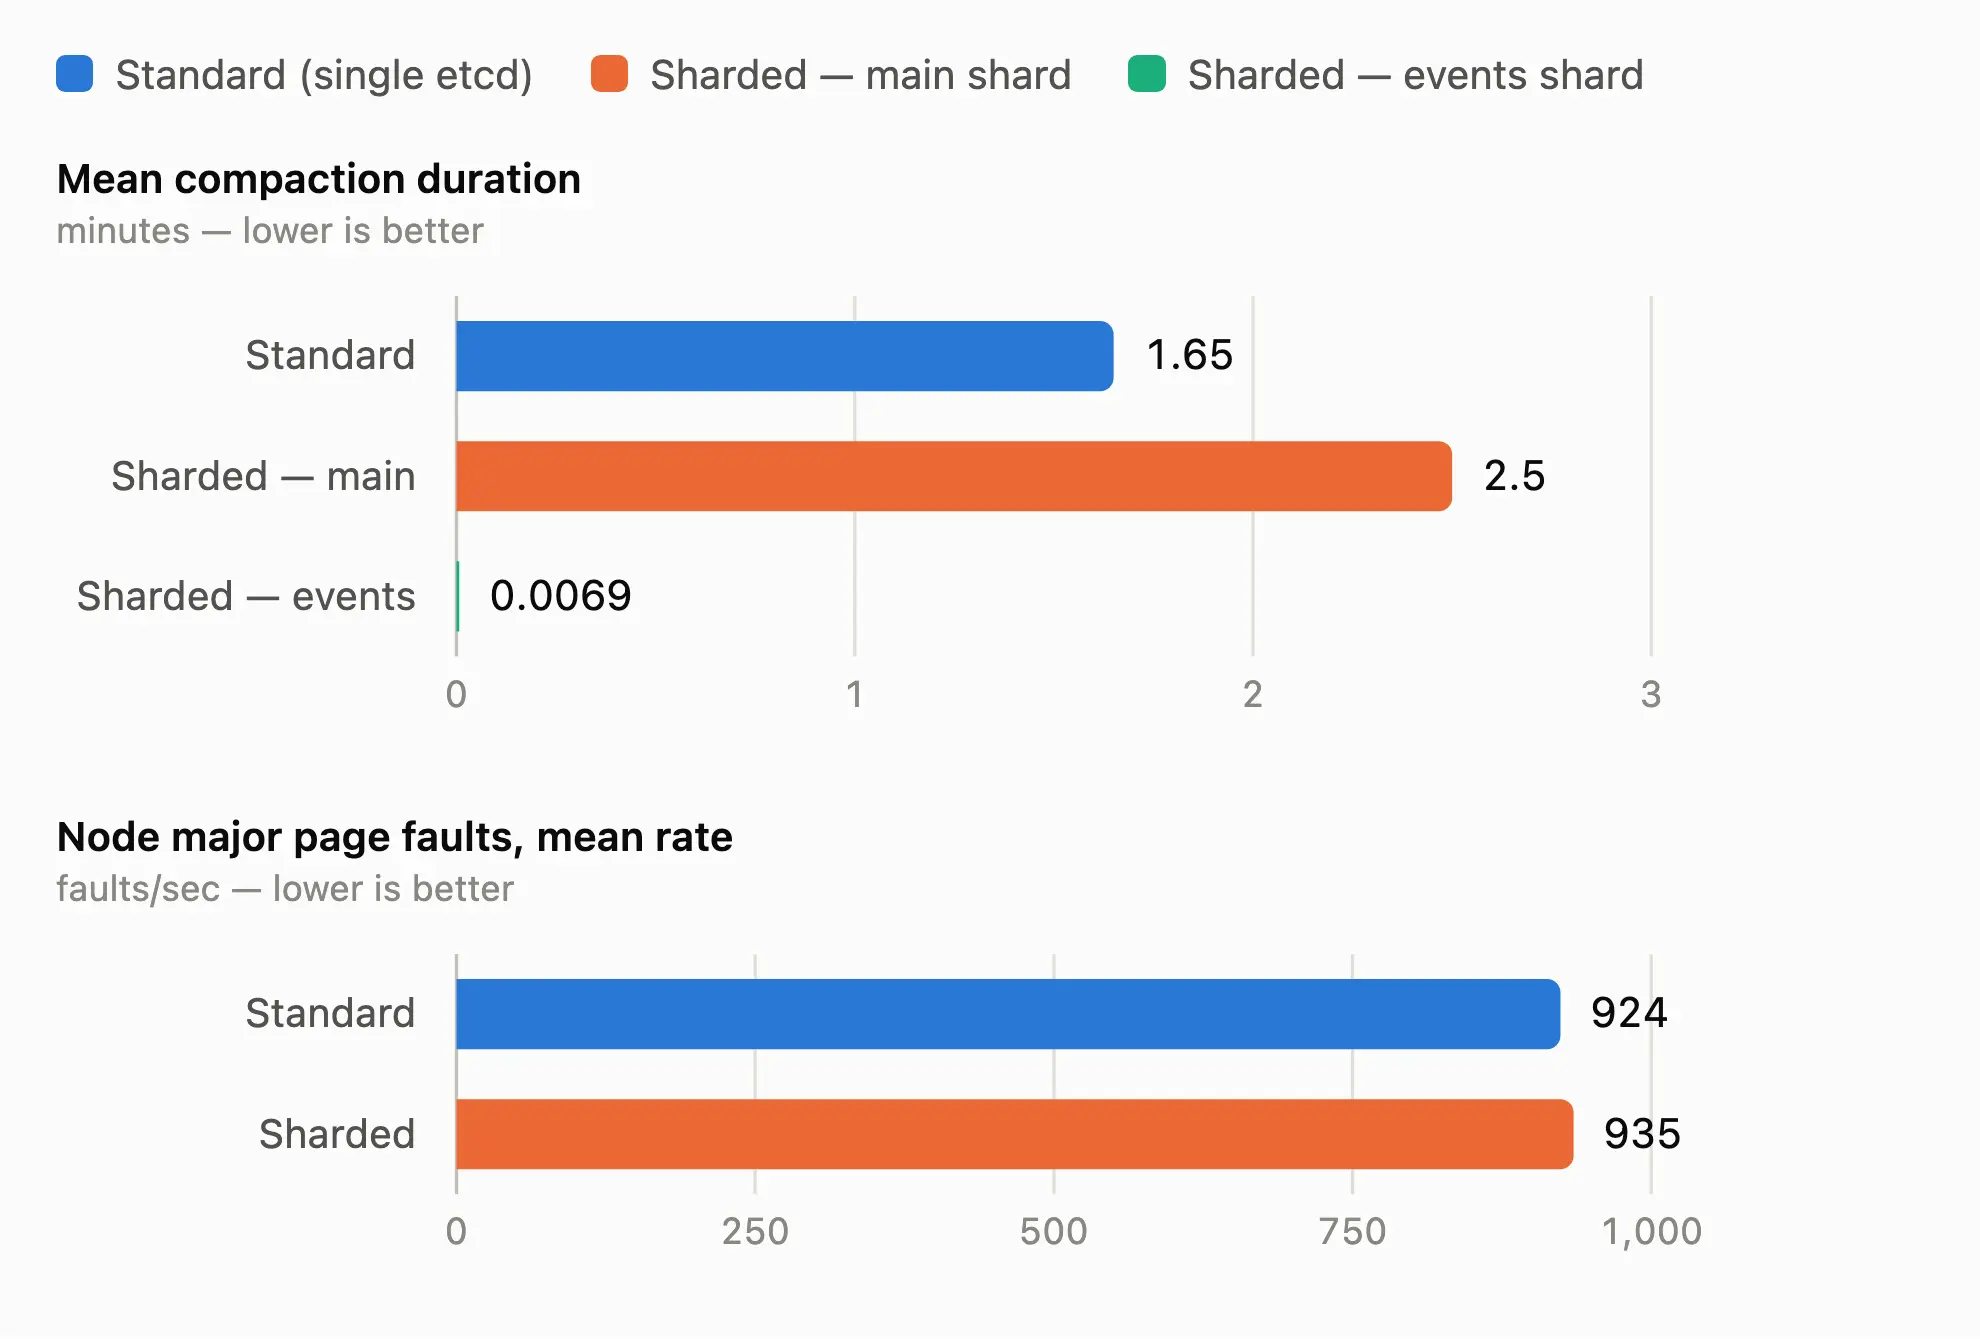
With almost all of the data in the main shard (which is correct, because these are custom resources, not events), compaction there took about 51% longer, and its growth rate was 85% longer. Everything else held: Finish times, WAL fsync and commit latencies, raft proposal rates, network usage, CPU and memory were all comparable.
Mean compaction duration
- Standard: 1.65 min
- Main shard: 2.50 min
- Events shard: 416 ms
- Change: +51.5%
Compaction growth rate
- Standard: 1.03 min
- Main shard: 1.91 min
- Events shard: 76.2 ms
- Change: +85.4%
Node major page faults (mean rate)
- Standard: 924/s
- Main shard: 935/s
- Events shard: —
- Change: +1.2%
Our working hypothesis is memory pressure: Compaction stalls while pages are fetched back from disk. We want to be careful about how strongly we state that, though. The major page-fault rates in the 2 arms are almost identical (924/s versus 935/s) so the page-fault data on its own does not establish the causal story. This is still an open investigation, not a characterised limitation, and it only appeared when deploying large custom resources at scale with a dedicated events shard. If you are running that profile, this is the result to watch.
The memory tax
2 etcd processes cost more resident memory than 1. That's not surprising in itself, but the size of the gap is (see Figure 7).
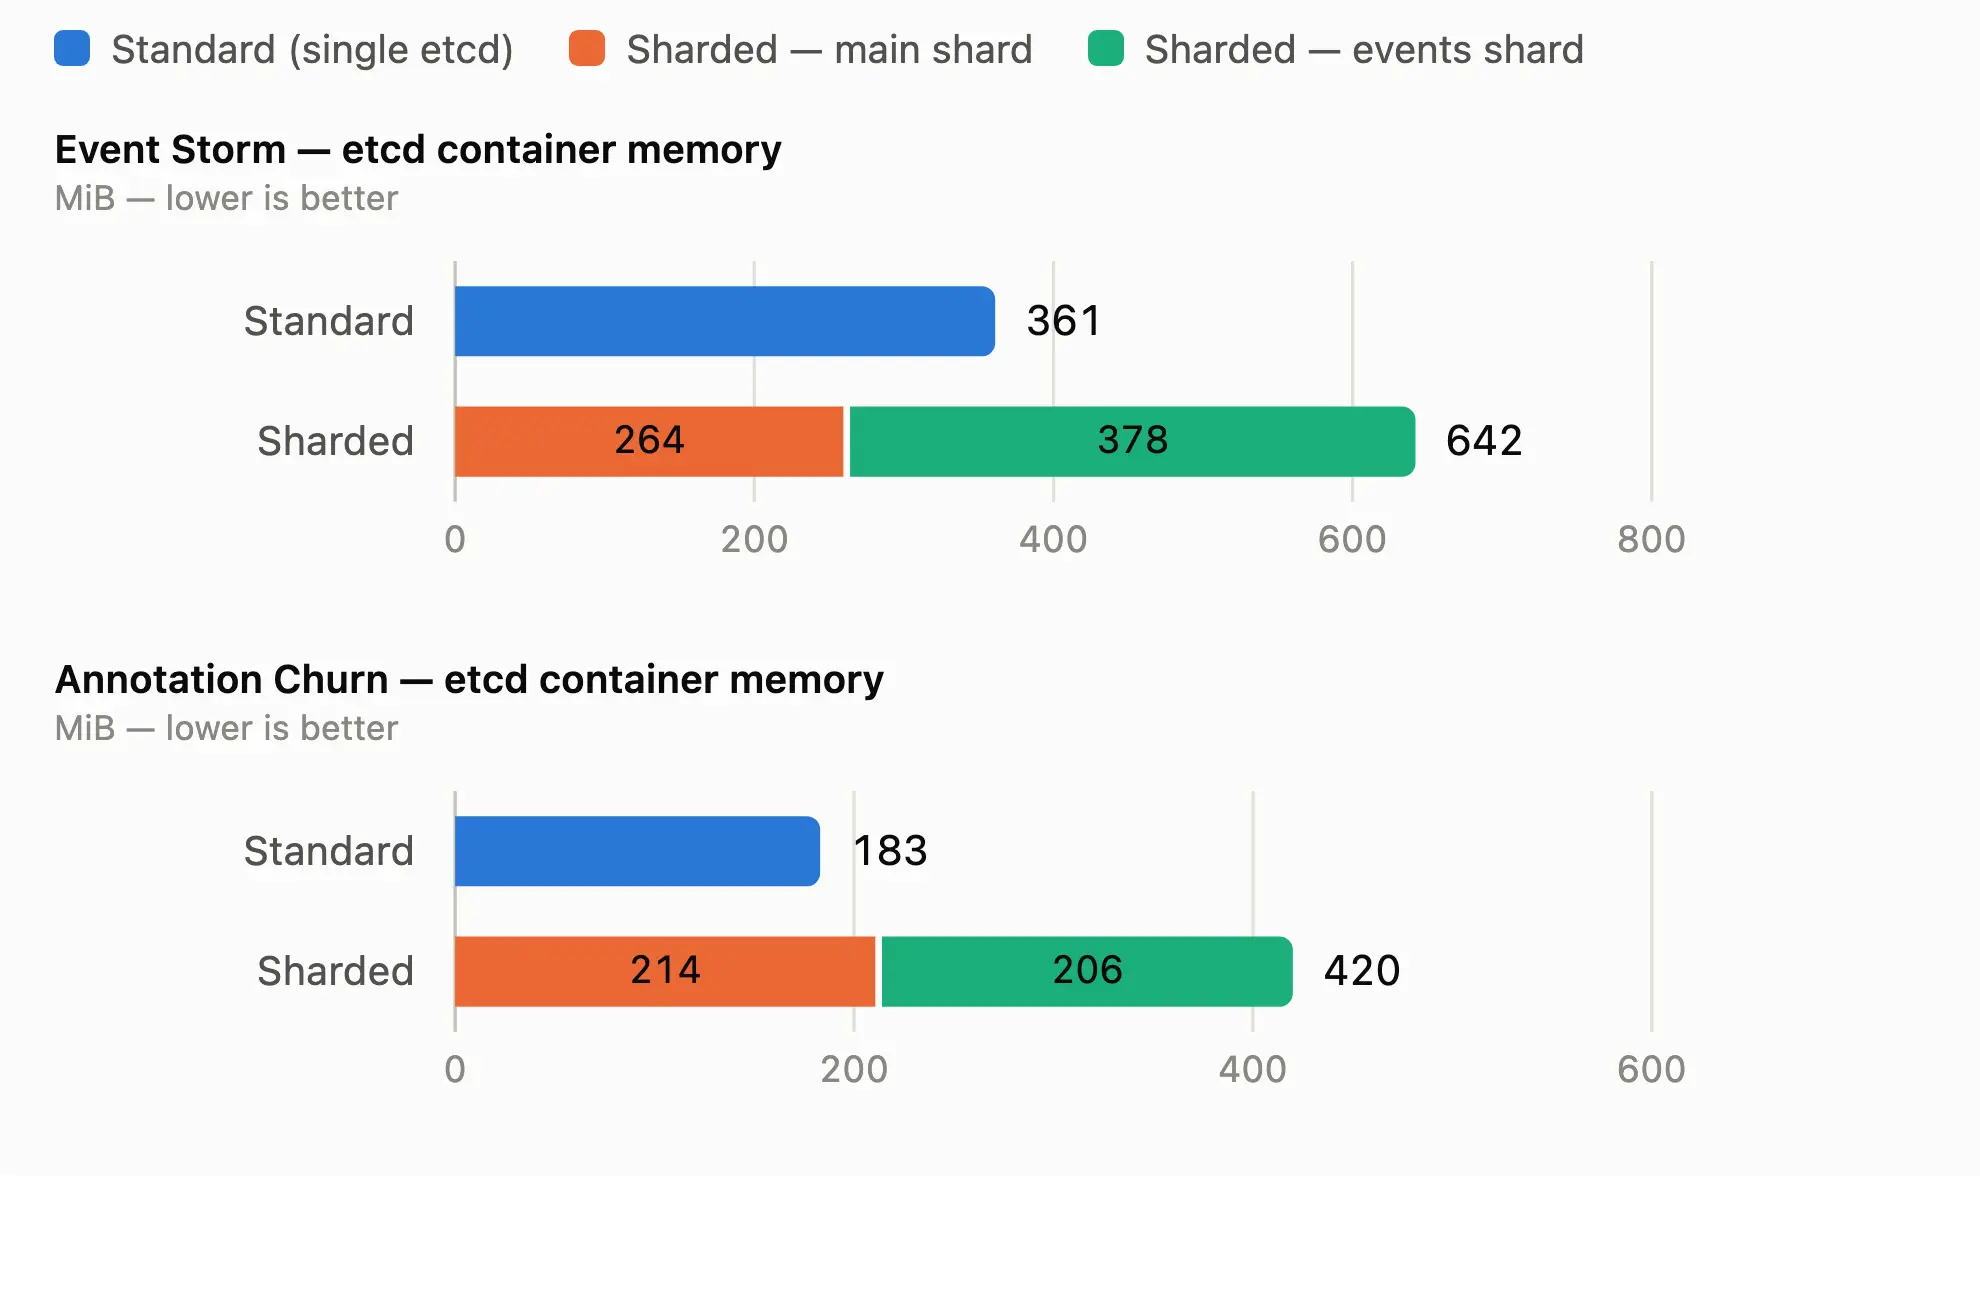
In the event storm run, the single etcd container peaked at around 361 MiB. The 2 sharded containers came to approximately 642 MiB combined, which is about 78% more. In annotation churn, the gap is wider: 183 MiB against 420 MiB, roughly 2.3x. The other 2 workloads (crashlooping pods and DB quota pressure) had comparable memory usage in both standard and sharded configurations.
We could not find anything in the etcd DB-sizing metrics to explain it. Database size, key counts and fragment totals all track the split as expected, so the extra memory is not stored data. It may well be a per-container floor rather than a per-shard cost, which would make it roughly constant rather than something that scales with shard count. We have not confirmed that, and until we do it should be treated as real capacity-planning input.
Our conclusions
For a tech preview, these are the results we want to see. The mechanism does what it claims, the wins are in the places the design predicted, and the single regression is specific and reproducible enough to chase down.
- Sharding helps where it was designed to help: Under event pressure (synthetic or realistic), there is a clear improvement, with fewer slow applies, faster compaction and raft snapshots, better write throughput, and smaller fragments.
- Sharding does not cost end-user latency: Pod-ready latencies and workload finish times were comparable across arms in every variant. The kube-apiserver and scheduler metrics were slightly better in the sharded arm for latency, throughput, in-flight requests, and long-running requests.
- Sharding is more reliable under stress: The standard arm occasionally failed the event storm workload outright. The sharded arm never did, across any sample.
- Sharding costs memory, and it has 1 bad case: Roughly 1.8 to 2.3x etcd container memory, unexplained by DB-sizing metrics, plus a compaction regression under large-CR quota pressure that we do not yet fully understand.
What we are testing next
Of course testing doesn't stop with these results. We have more work to do:
- Deliberately exhausting the event shard's storage quota, to see what happens to the main shard and the rest of the cluster when one shard fills up.
- Running representative customer-shaped workloads (cluster-density and build-farm profiles), which stress control plane components differently from a pure event storm.
- A multi-shard configuration splitting leases, secrets and ConfigMaps into their own shards.
- A topology with 3 main shards, 3 lease shards, and 1 event shard, so cluster heartbeat traffic is isolated too.
Reproducing this for yourself
All 4 workload variants are part of kube-burner-ocp, so none of this depends on our lab. Point it at a hosted cluster with the etcd-density commands above and a metrics endpoint, and you will get the same time series we measured. The tooling, the workload definitions, and the metrics profiles are all open source under the cloud-bulldozer and kube-burner organisations.
If you run it against a topology we haven't covered (a different shard layout, a different workload mix, bare metal instead of AWS, and so on), then we'd love to hear what you find.

