As organizations deploy increasingly sophisticated AI, analytics, and entity-resolution workloads, they're discovering a common bottleneck: memory.
Many modern applications are no longer constrained by CPU availability. Instead, they are limited by the amount of memory economically deployed within a single server or cluster. Whether you're processing electronic warfare (EW) signals, running large-scale graph analytics, or building AI inference pipelines, you will likely hit a "memory wall" long before you run out of CPU power.
Traditional infrastructure tightly couples memory and compute resources. When applications require additional memory, organizations typically have two options: purchase larger servers or add nodes and redistribute workloads.
Both approaches increase infrastructure costs and operational complexity. This challenge becomes particularly acute for AI and analytics workloads processing large in-memory datasets. Compute resources can remain available while workloads become constrained by local memory capacity.
For sovereign computing environments, defense organizations, and regulated industries, moving these workloads to hyperscale cloud platforms might not be viable due to security, governance, data sovereignty, or compliance requirements. A different architectural model is required: one that treats memory as a shared resource across the datacenter rather than a fixed resource attached to individual servers.
Memory-first infrastructure on OpenShift
Kove:SDM implements a software-defined memory architecture that disaggregates memory from compute infrastructure. Instead of limiting workloads to the physical DRAM installed within a server, idle memory resources across multiple systems can be pooled and dynamically allocated to applications running on Red Hat OpenShift.
This enables applications to access memory resources significantly larger than the physical memory available within the local node while continuing to operate as standard containerized workloads. From the application perspective:
- No code changes are required
- No container image modifications are required
- No application re-architecture is required
Memory allocation remains transparent to the workload while OpenShift continues to provide orchestration, scheduling, security, and lifecycle management.
Validating the architecture: WASP EW pipeline testing
To evaluate real-world behavior under memory pressure, we tested the World All Source Platform (WASP) Electronic Warfare (EW) pipeline on Red Hat OpenShift 4.18. The workload processes Pulse Descriptor Word (PDW) data generated by simulated emitters and receivers. We chose the EW classifier component because its memory consumption scales directly with the number of concurrent classifier pods, making it ideal for evaluating memory extension technologies.
For this test, we disabled DBSCAN clustering. DBSCAN is CPU-bound and would have made the test CPU-limited rather than memory-limited, which is not what we wanted to measure. The classifiers ran the data loading and in-memory processing stages, providing a clearer, accurate assessment of memory capacity and Kove's ability to serve that memory transparently.
Test environment
| Component | Configuration |
|---|---|
| Platform | Red Hat OpenShift 4.18.24 |
| OpenShift cluster size | 3-node compact cluster (2x Intel Gold 6430, 256 GB RAM each) |
| Memory cluster size | 3-node (64-core AMD EPYC, 768 GB RAM each) |
| Memory cluster OS | Red Hat Enterprise Linux |
| Kove:SDM pool | 2.112 TiB over RoCE fabric (3 XPDs, one per node) |
| Network | RoCE via Mellanox ConnectX-5 (mlx5_0) |
| Storage | OpenShift Data Foundation (Ceph/RBD + CephFS) |
| Additional services | IBM Software Hub 5.3.0, watsonx.data 2.3.0, Spark 5.3.0, MinIO, PostgreSQL 15 |
Before testing started, we deployed and ran the full WASP stack, including Keycloak, MinIO, PostgreSQL 15, Auth Service, Execution Broker, Runner, Listeners, Database IO, and Frontend.
What was tested
Each run used the same fleet of 20 EW emitters and 10 EW receivers writing PDW Parquet data to MinIO. The variable across runs was the classifier count and whether Kove:SDM was active.
| Run | Classifiers | Kove | Duration | Purpose |
|---|---|---|---|---|
| 1 | 45 | Off | 1 hour | Baseline—native DRAM only |
| 2 | 45 | On | 1 hour | Same load with Kove—performance comparison |
| 3 | 225 | On | Scaling | Push Kove pool toward capacity |
Note: We monitored performance with OpenShift web console dashboards, the Kove management console, and a per-pod metrics script (kove-container-memory-stats.sh) capturing xmem stats at 5-second intervals.
Run 1: Baseline: Native DRAM only (45 classifiers, no Kove)
The first test established a baseline by running 45 classifier pods without Kove:SDM enabled. This captured the native DRAM performance ceiling with 20 emitters, 10 receivers, and 45 classifiers running across all 3 nodes. As shown in Figure 1, all 45 sim-classifier pods and supporting stack components are deployed and running within the Red Hat OpenShift environment.
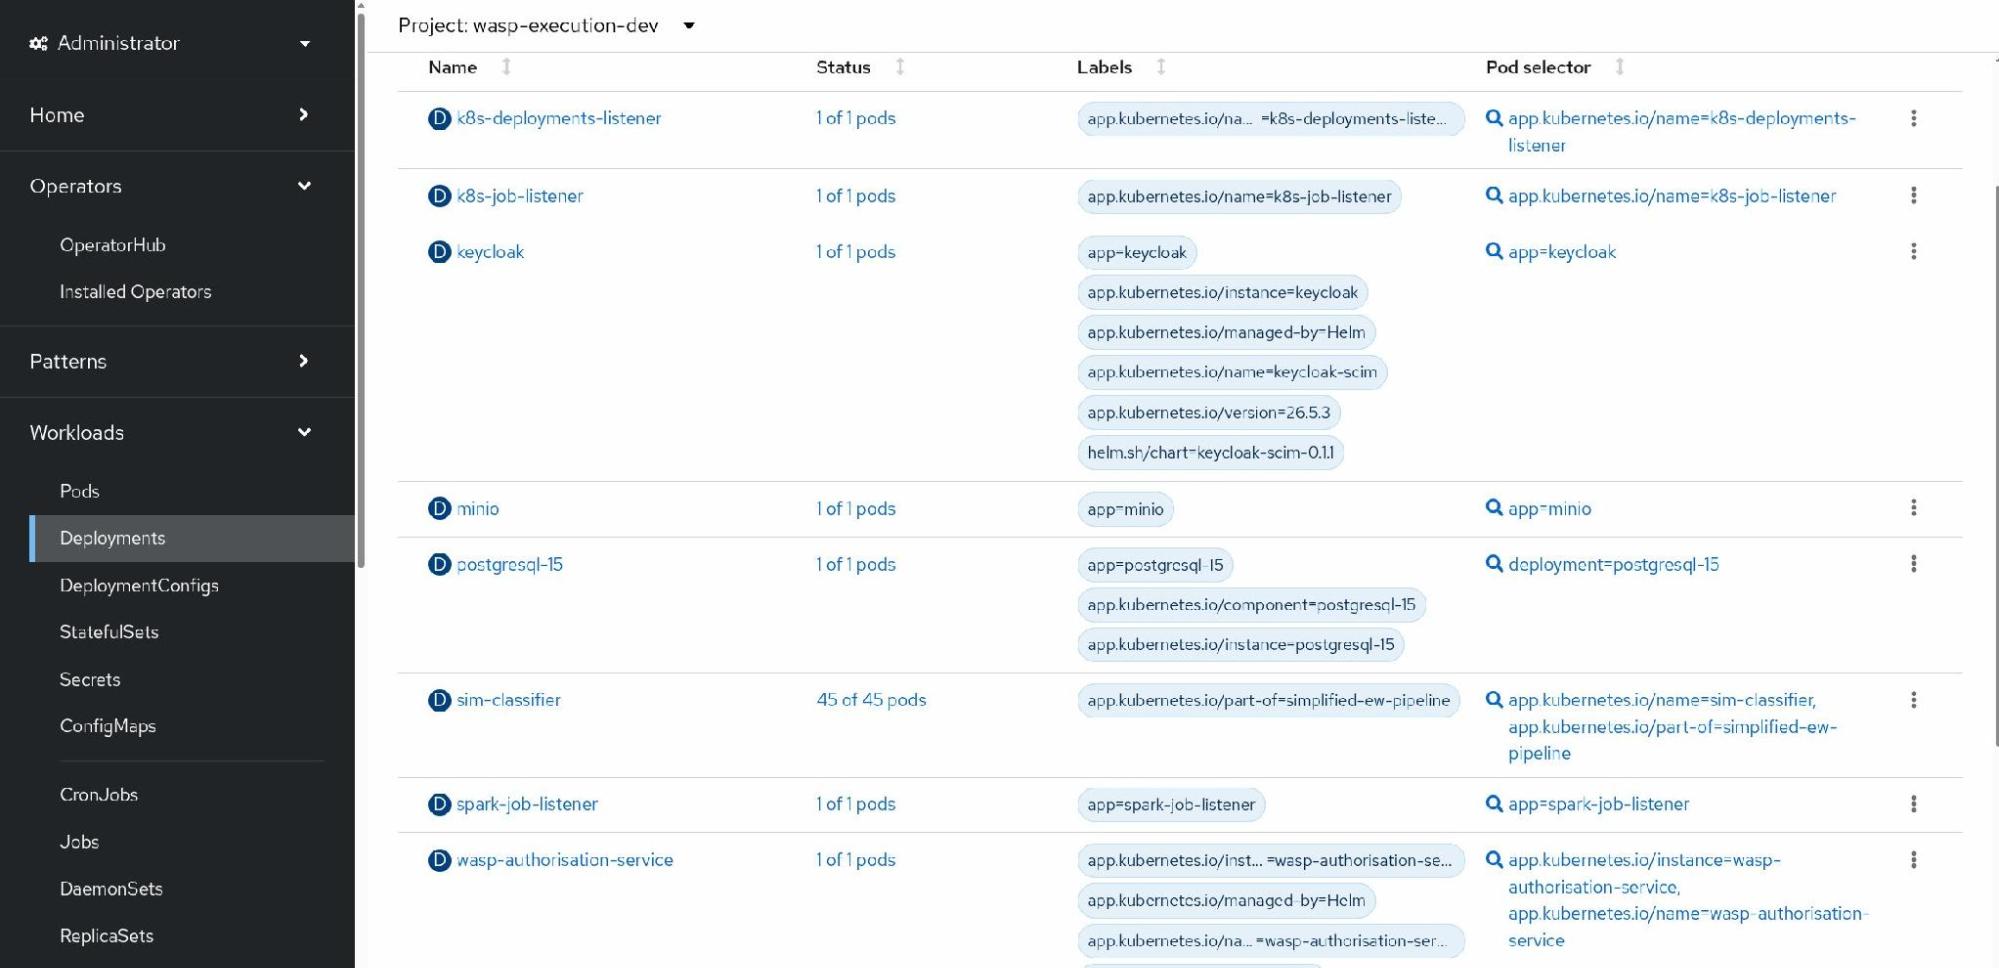
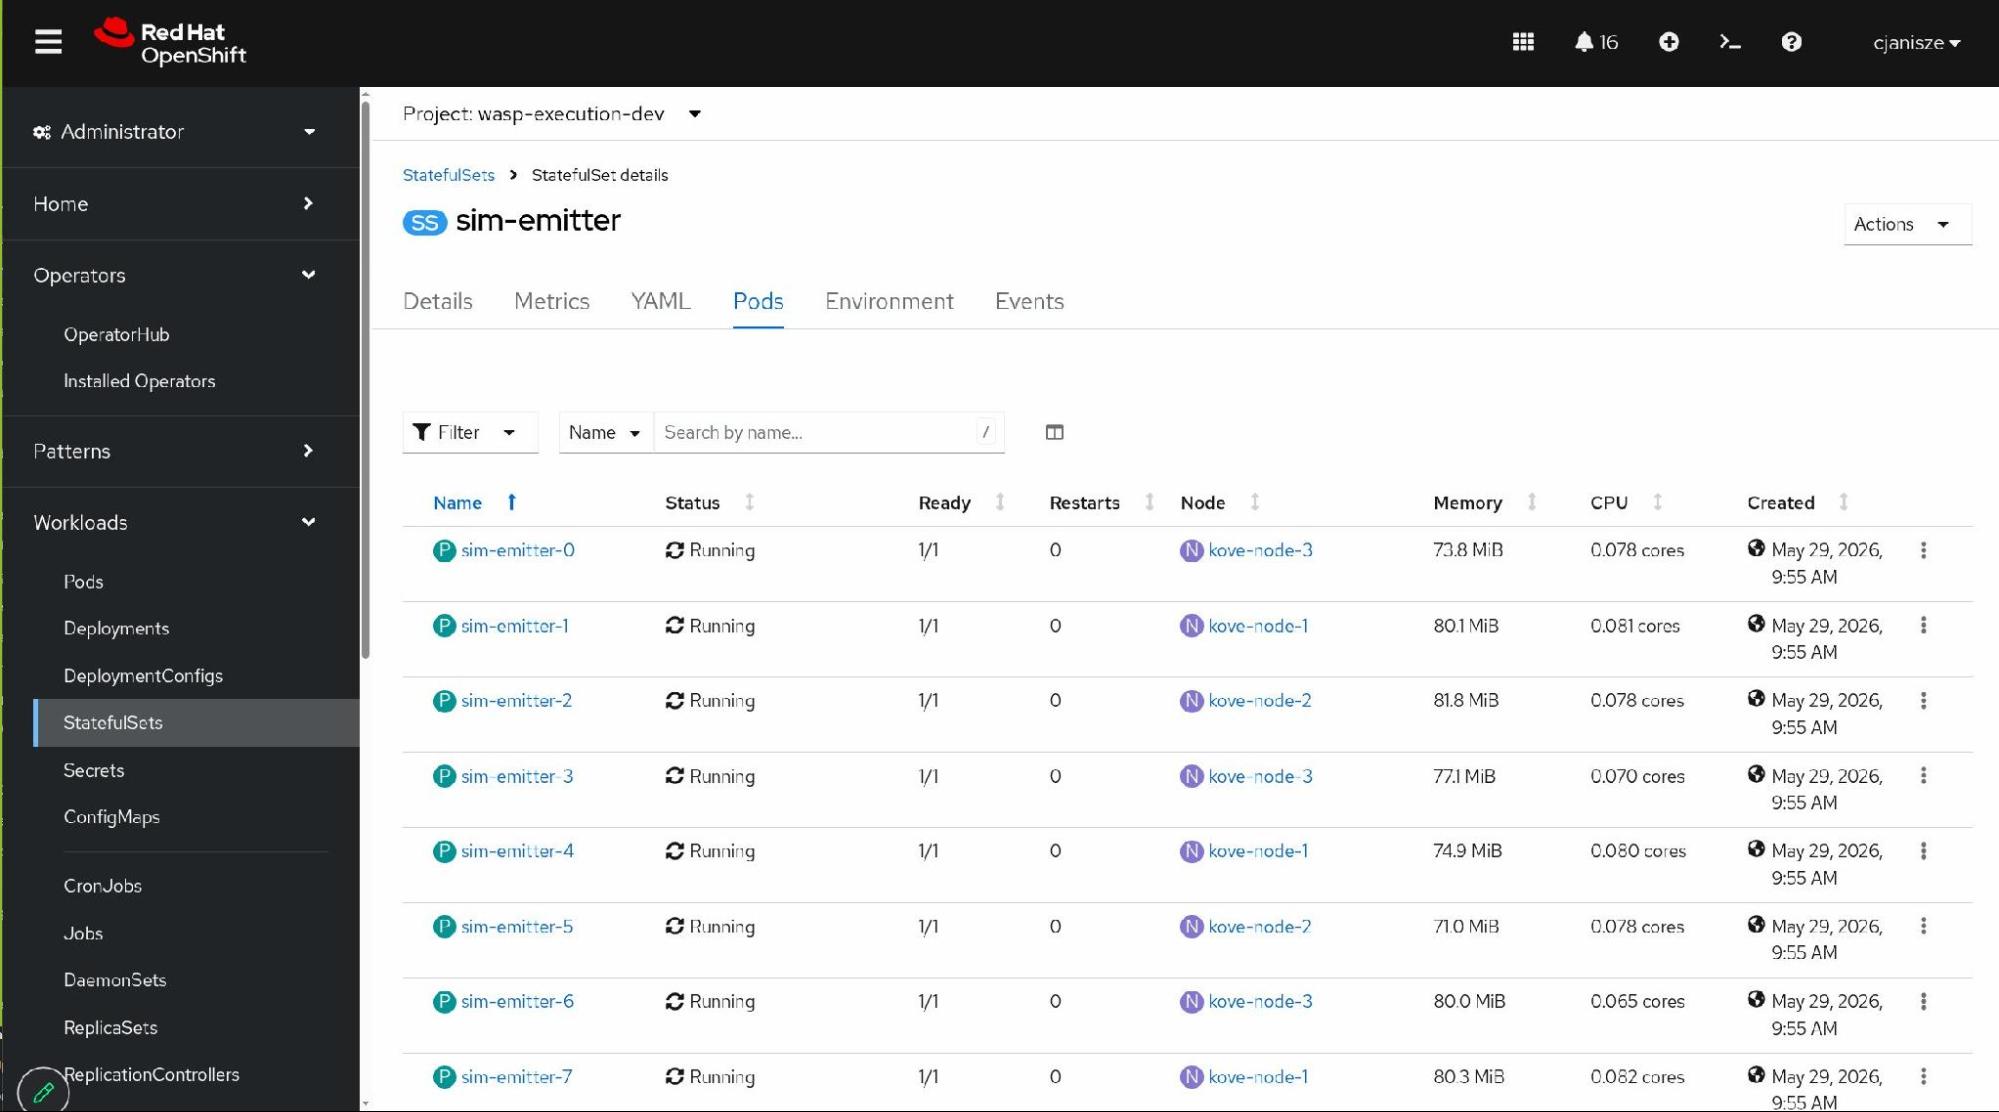
Figure 2 demonstrates the distribution of simulated emitter pods across all three nodes in the cluster.
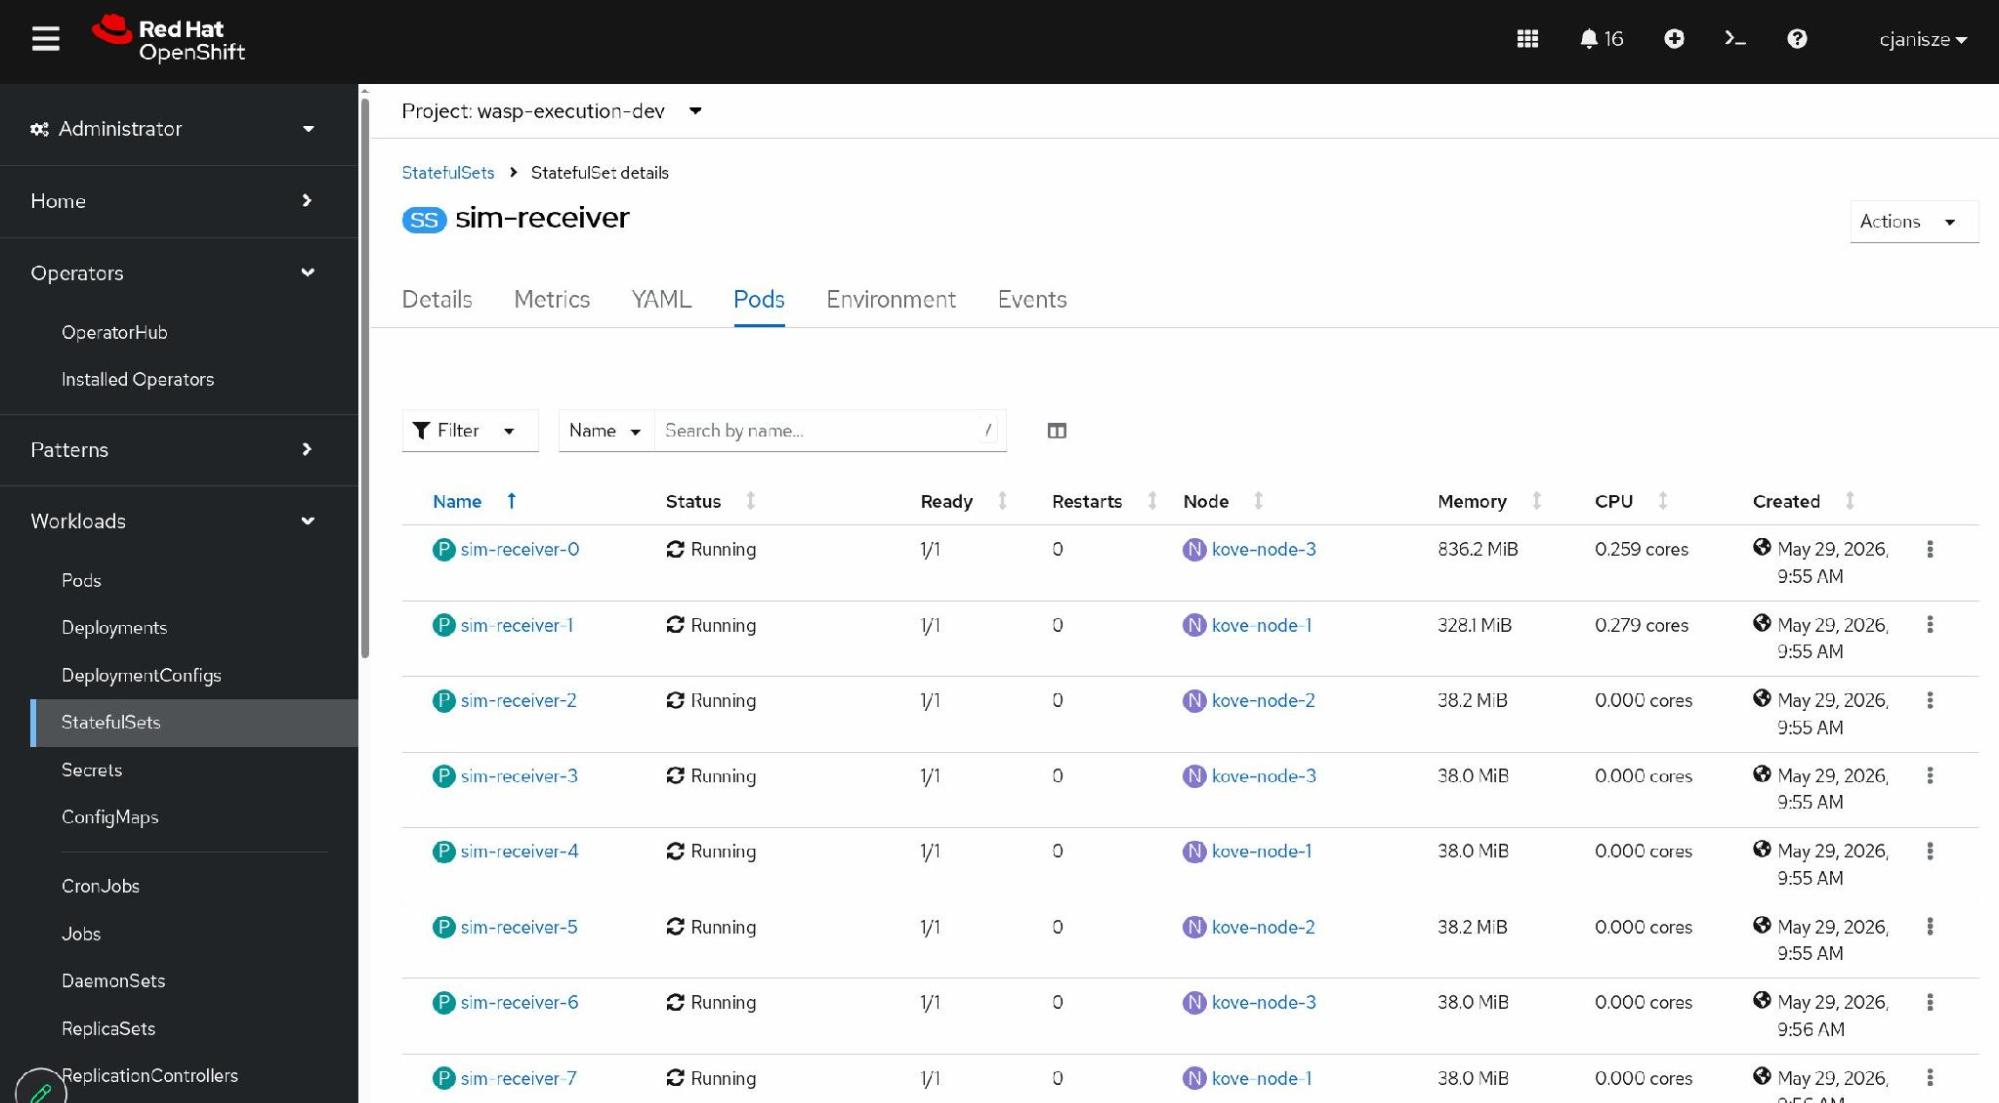
Similarly, Figure 3 highlights the receiver pods balanced across the same cluster topology.
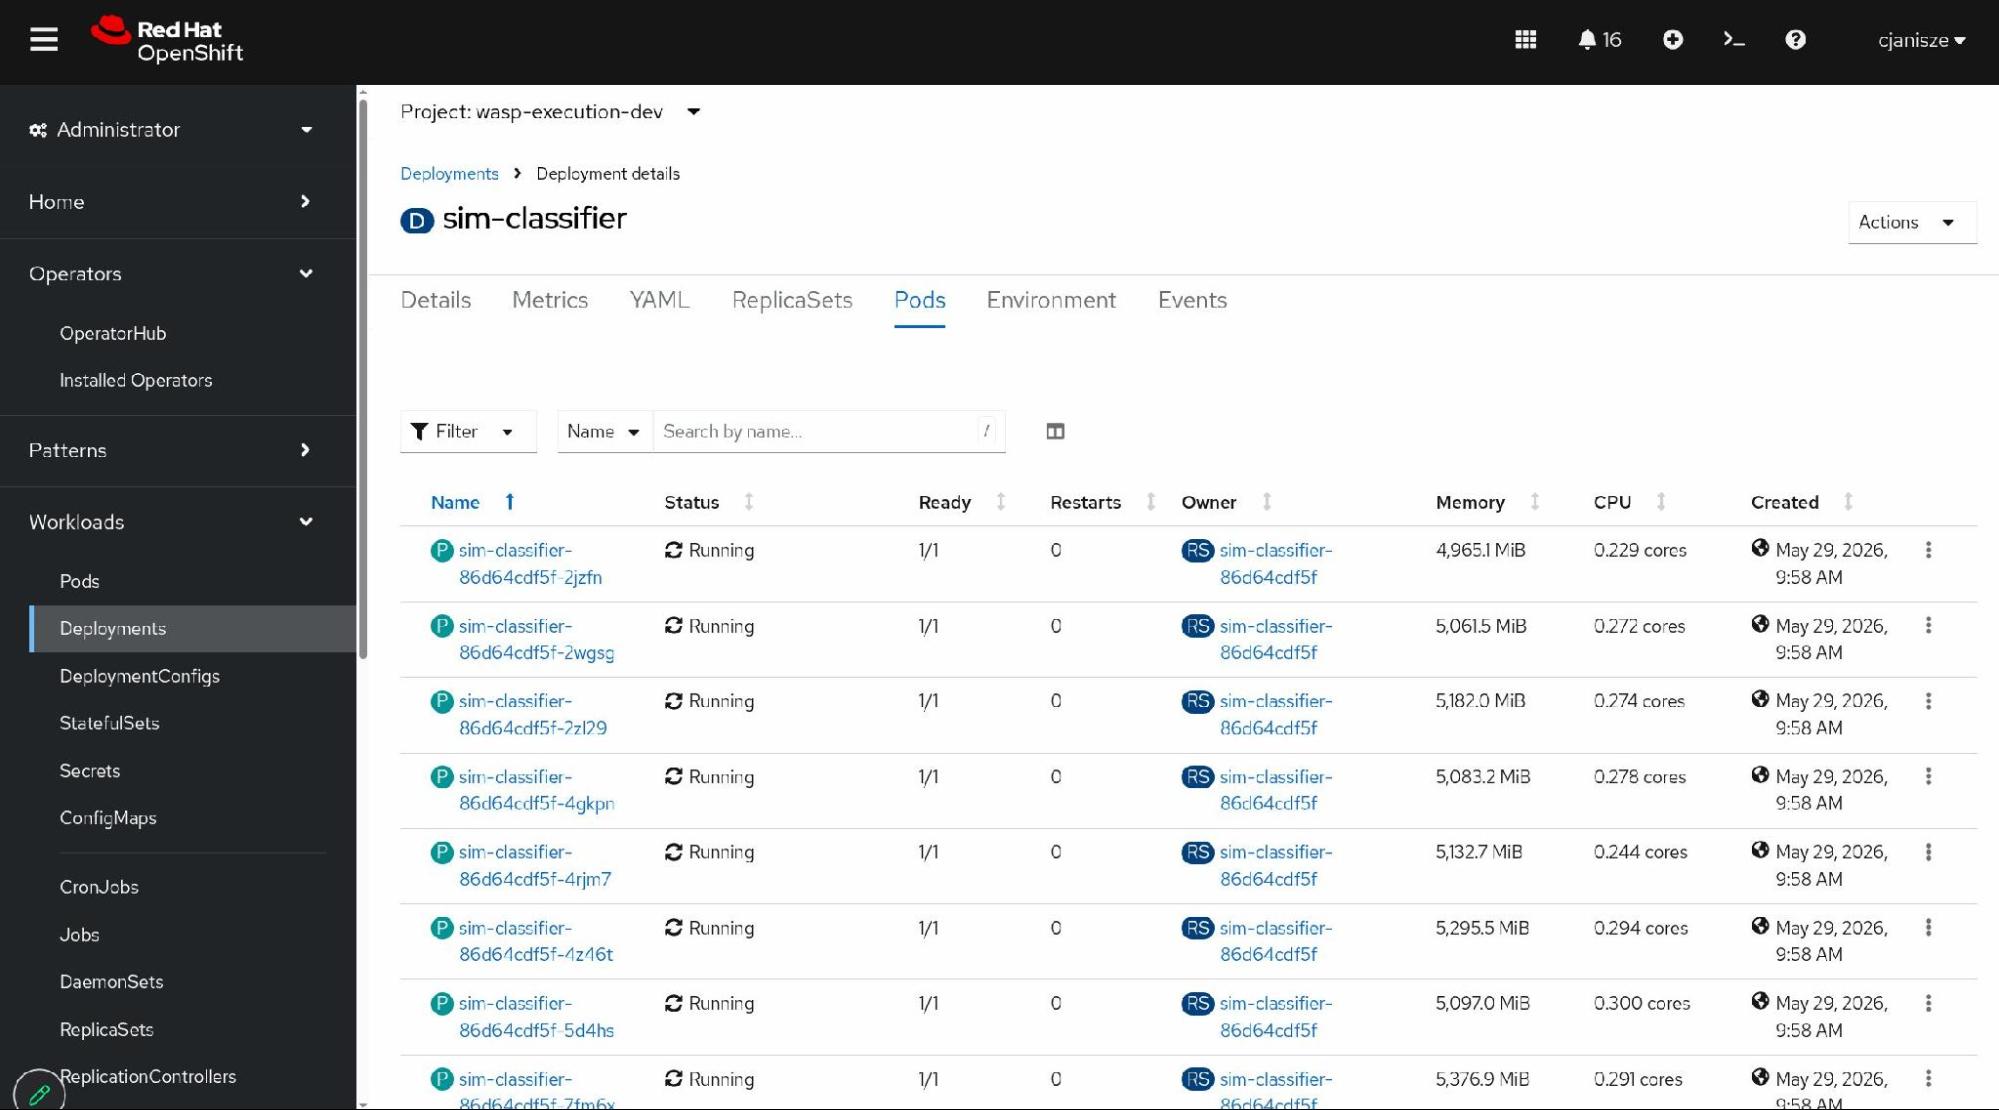
Individual resource allocation per pod during the baseline test is detailed in Figure 4.
At peak workload, the namespace metrics captured in Figure 5 show healthy memory limits without risk of out-of-memory errors.
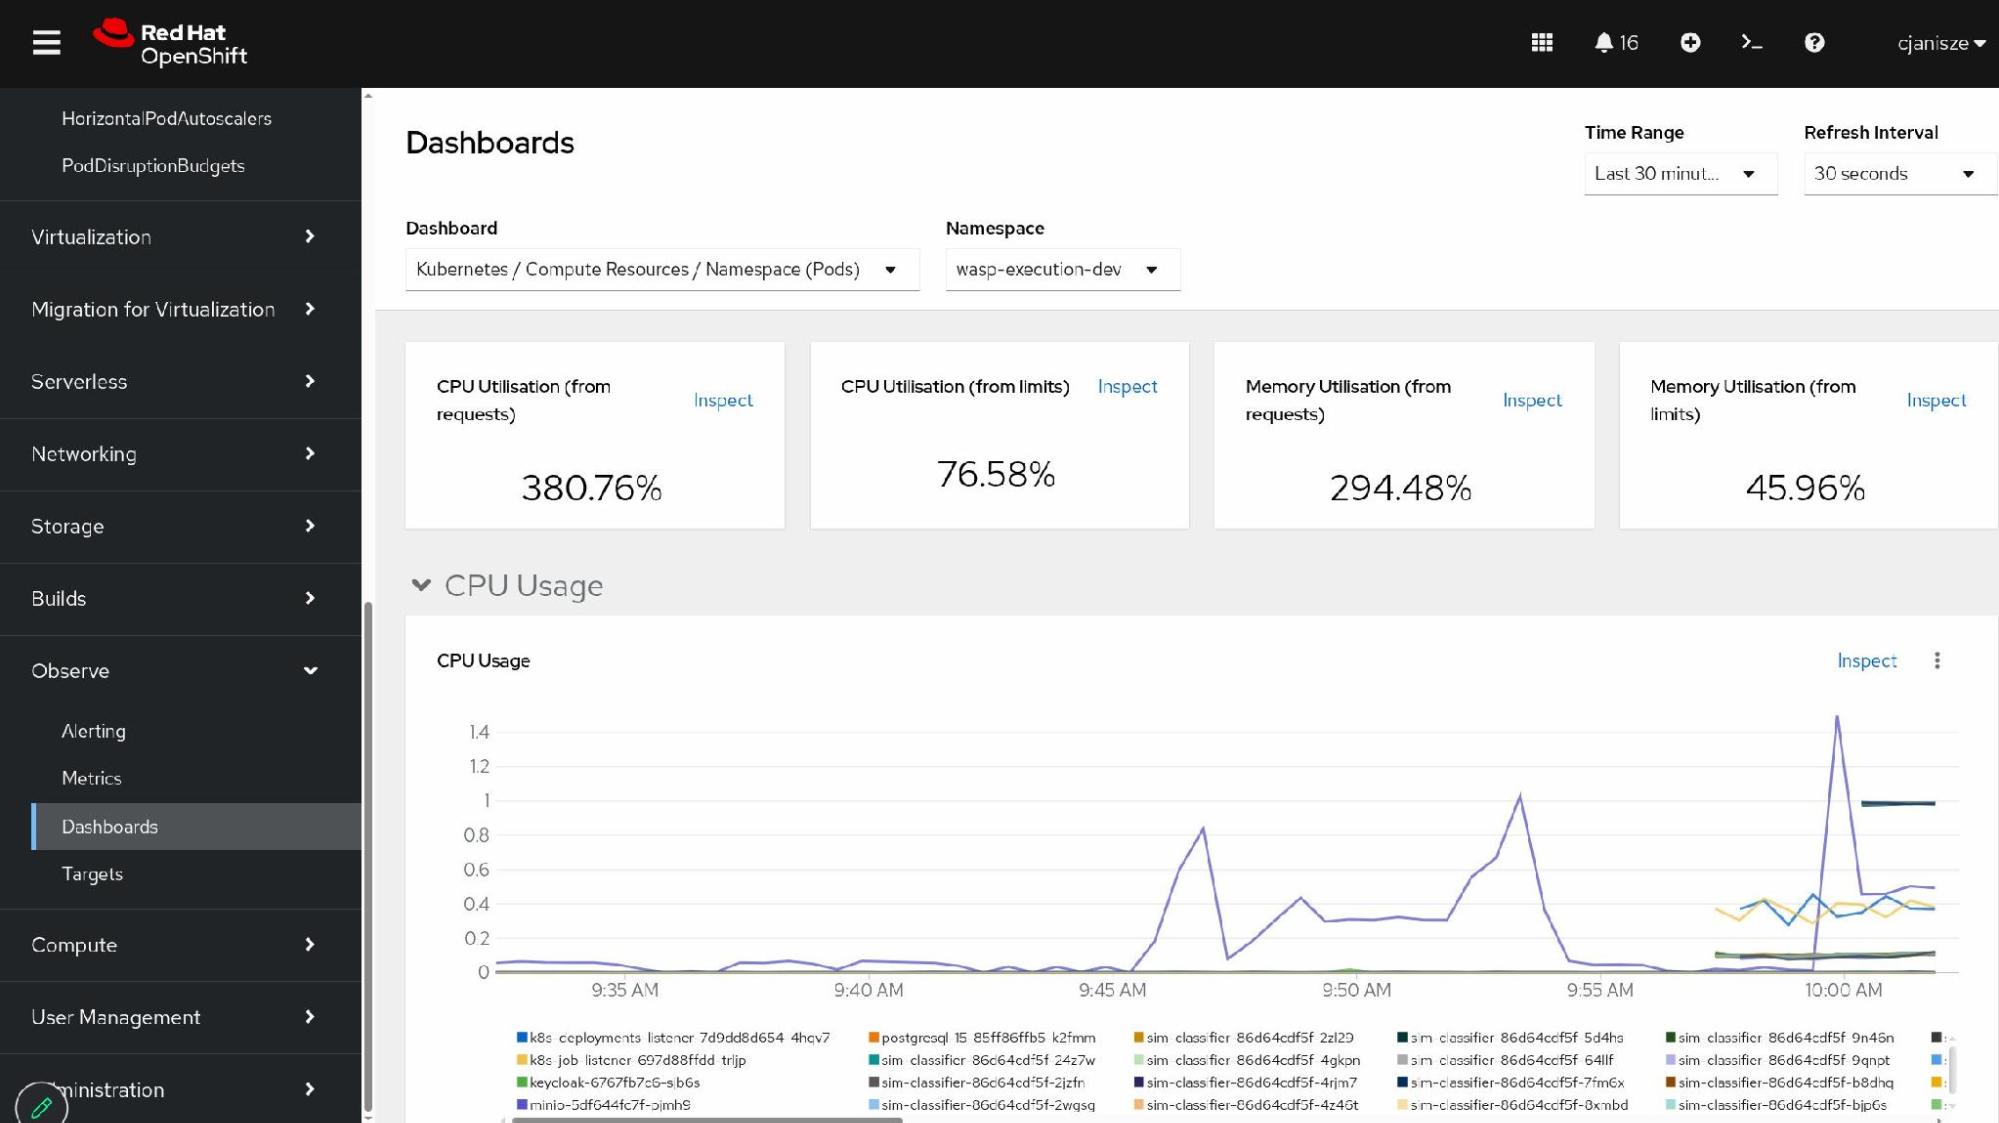
Memory utilization from requests was around 294%; this means pods were consuming about 3 times what they declared as their Kubernetes memory request. That sounds high but is expected; requests are just the scheduler reservation, not a cap. The more relevant number is utilization from limits at 46%, which means the pods were using less than half their hard limit and were not at risk of being OOM-killed. CPU utilization from limits was 77%, which is healthy but not saturated and consistent with DBSCAN being disabled for this test.
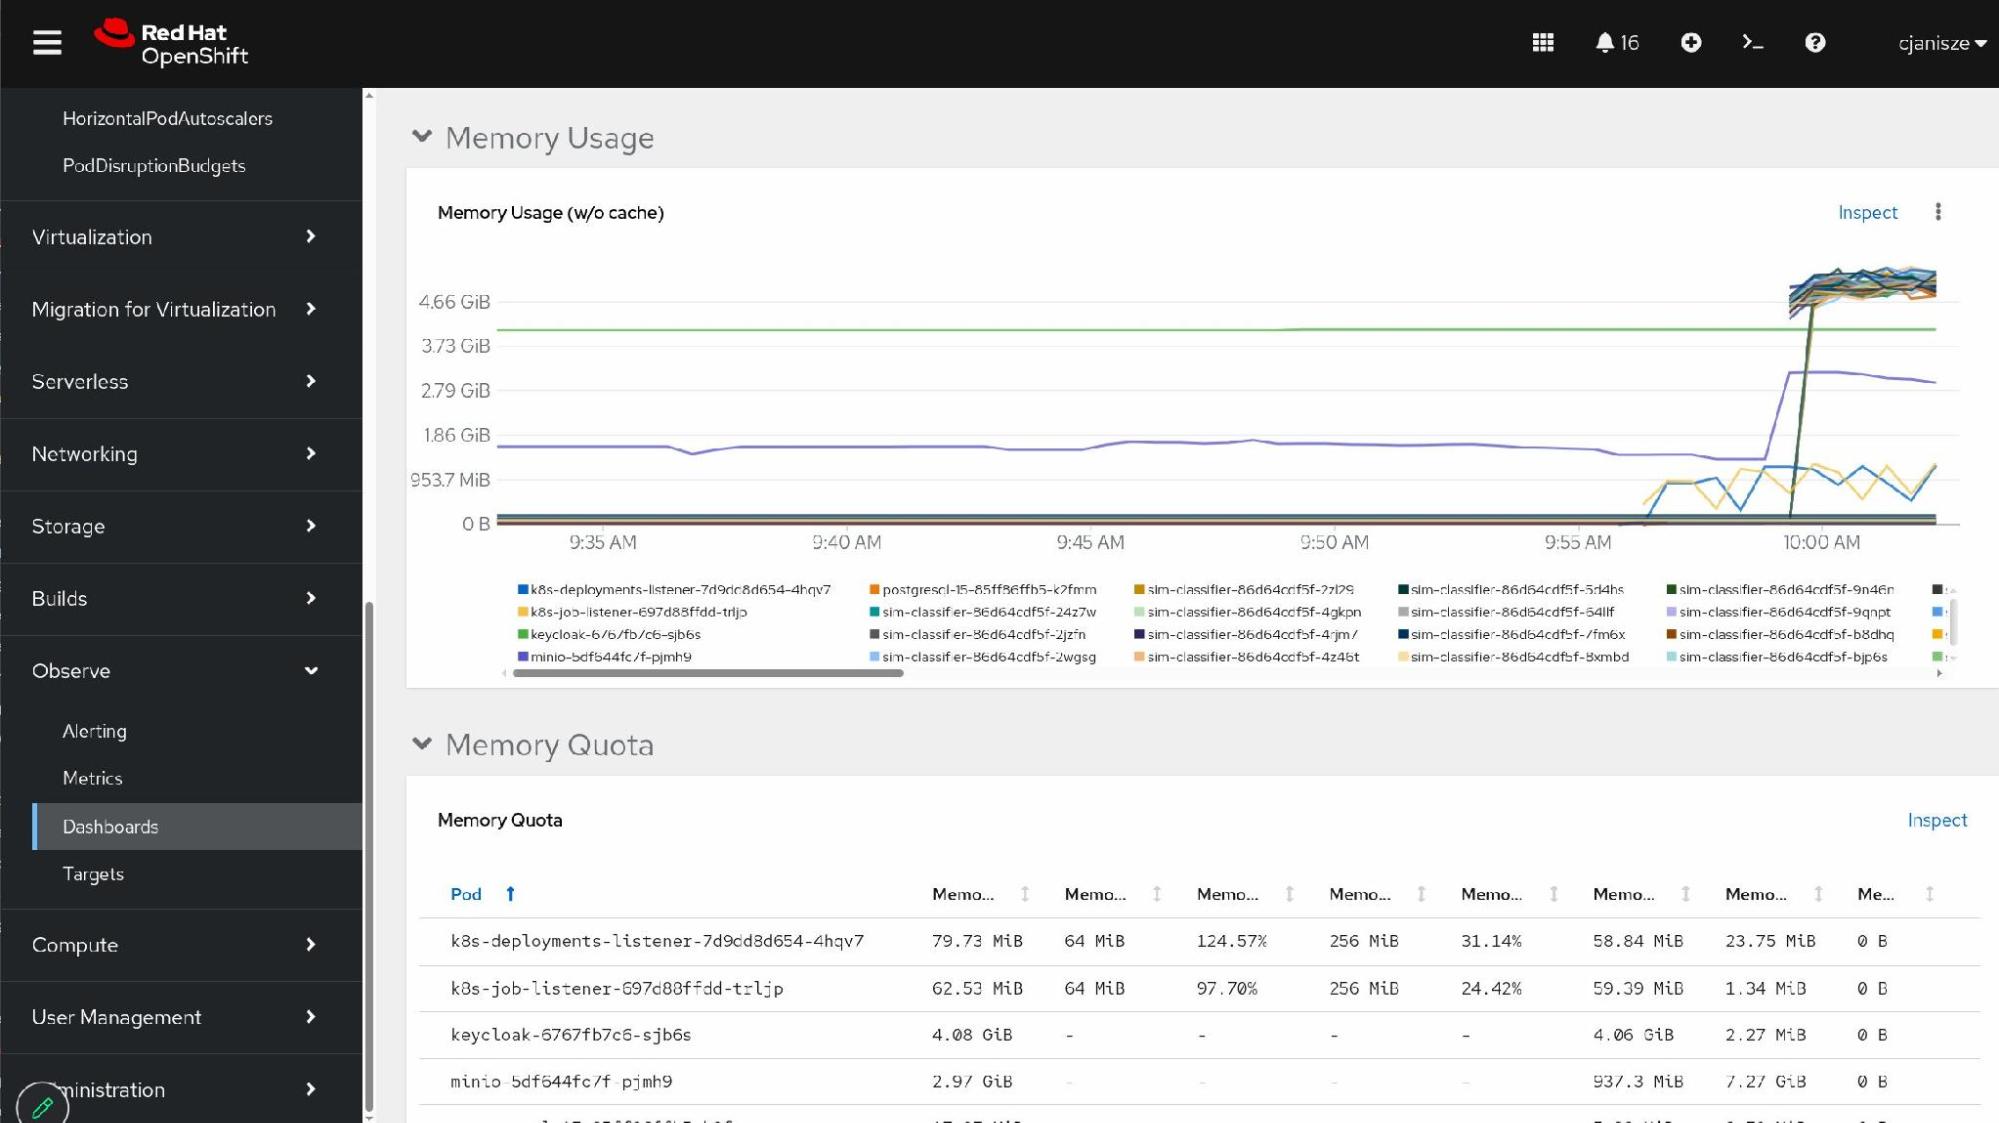
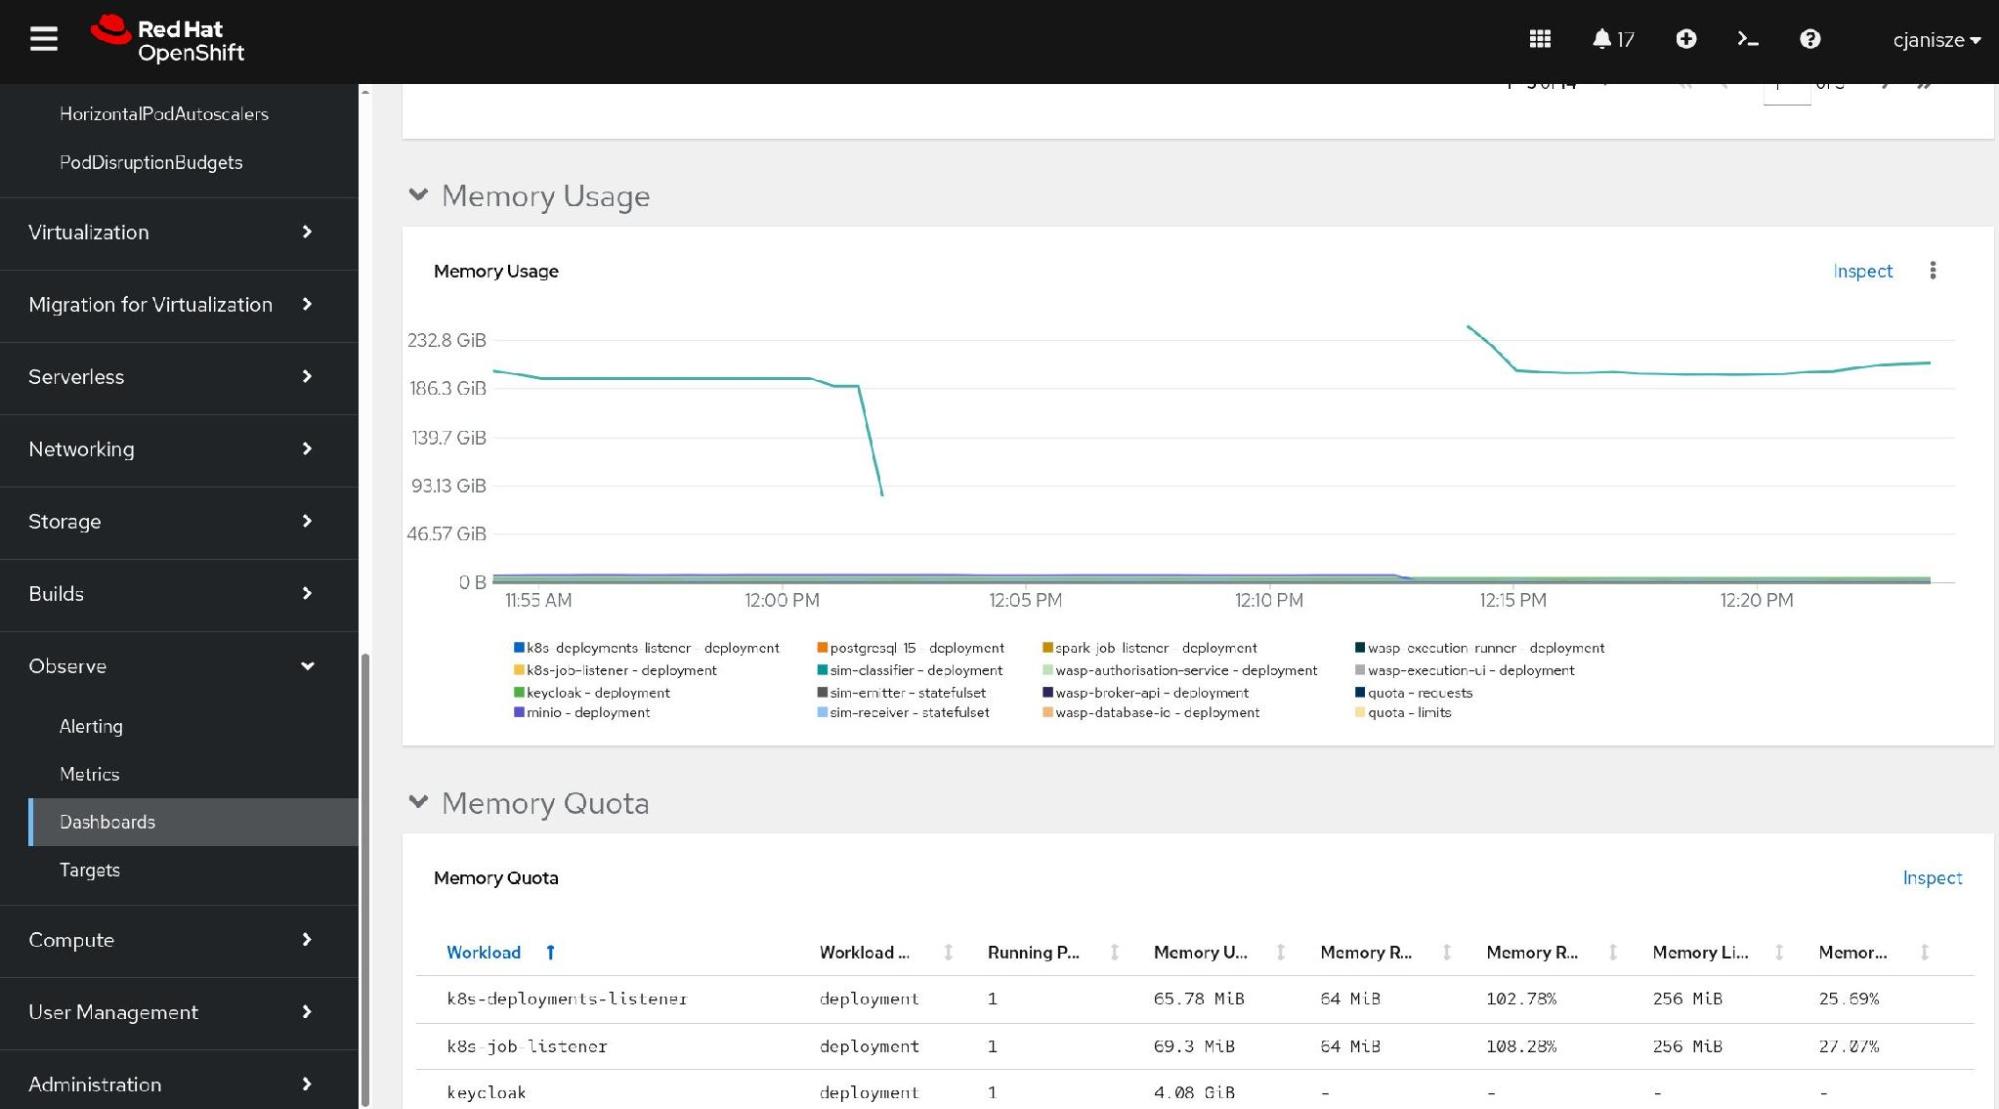
Figure 6 displays the cluster memory usage timeline alongside configured pod quotas during the initial run.
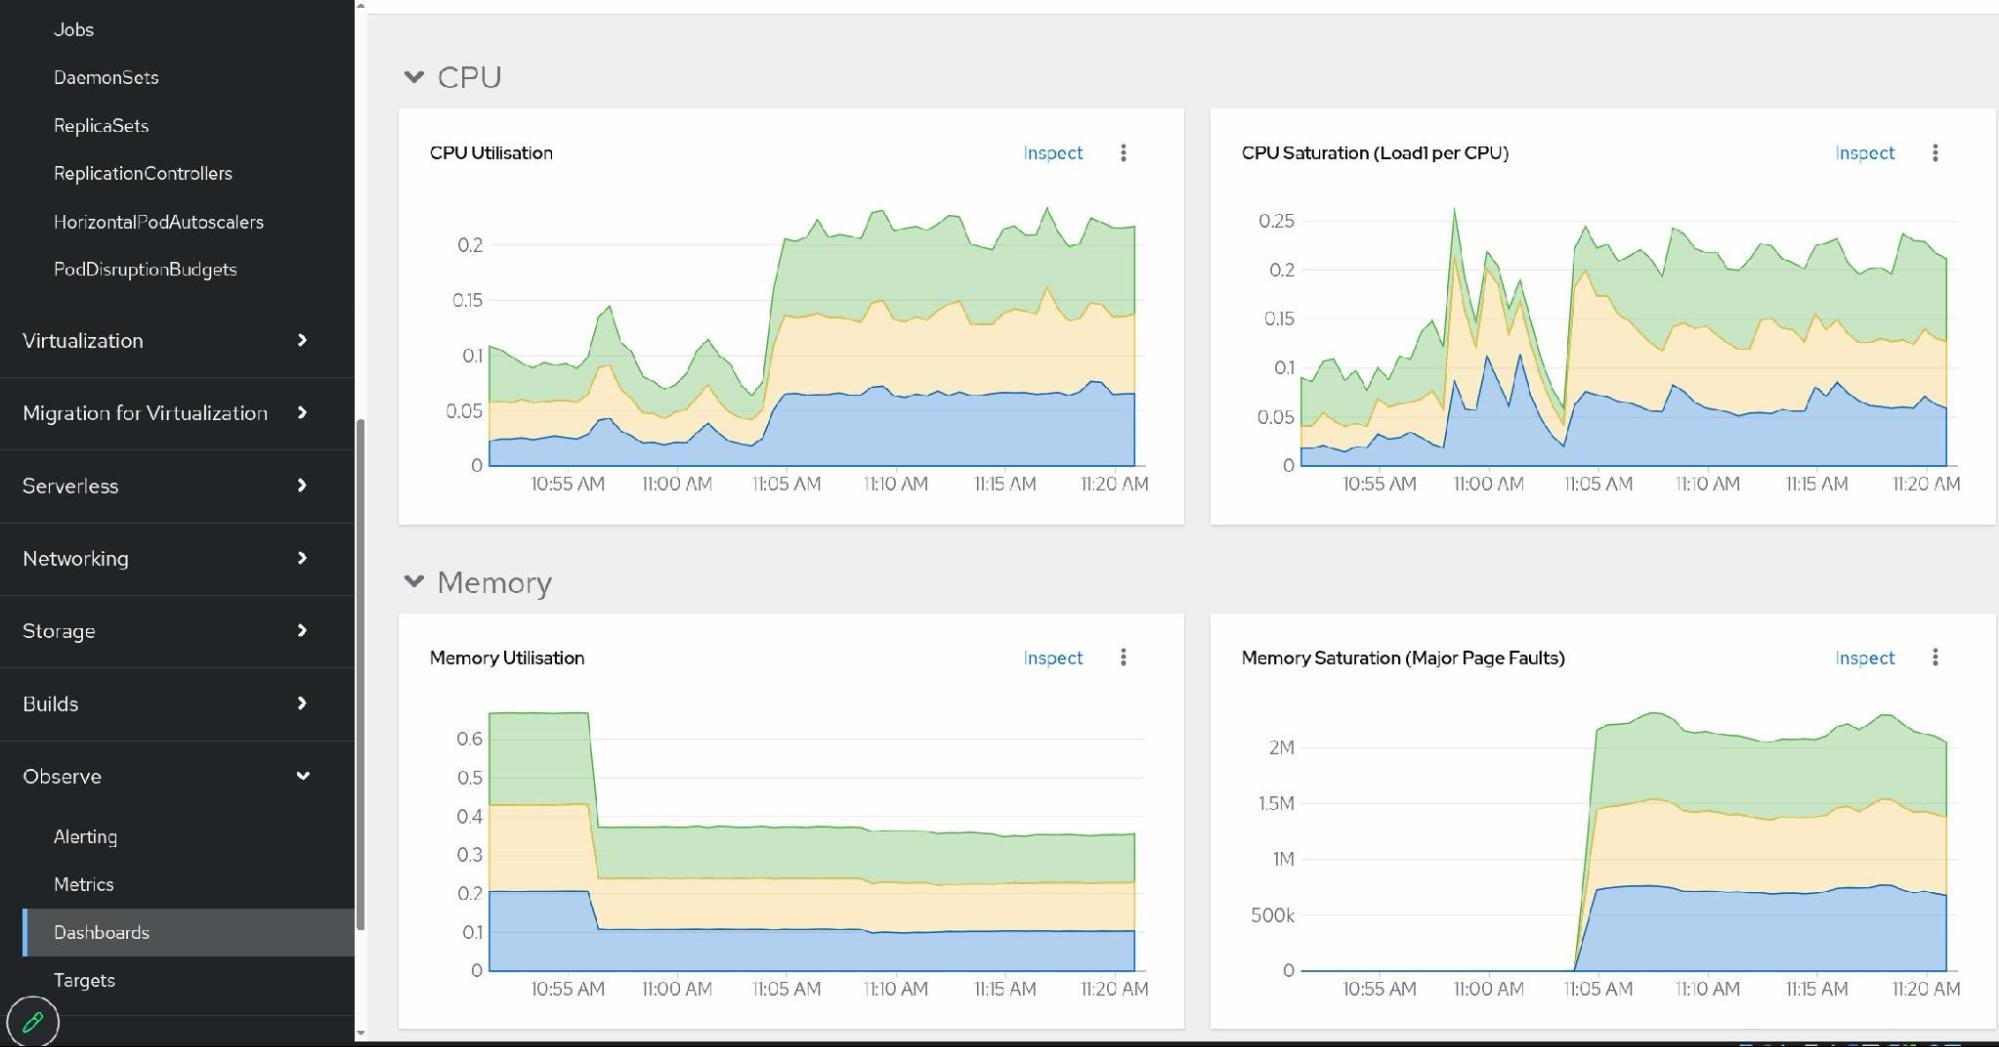
As illustrated in Figure 7, cluster-level memory jumps to 60% capacity while major page faults remain near zero during native DRAM operations.
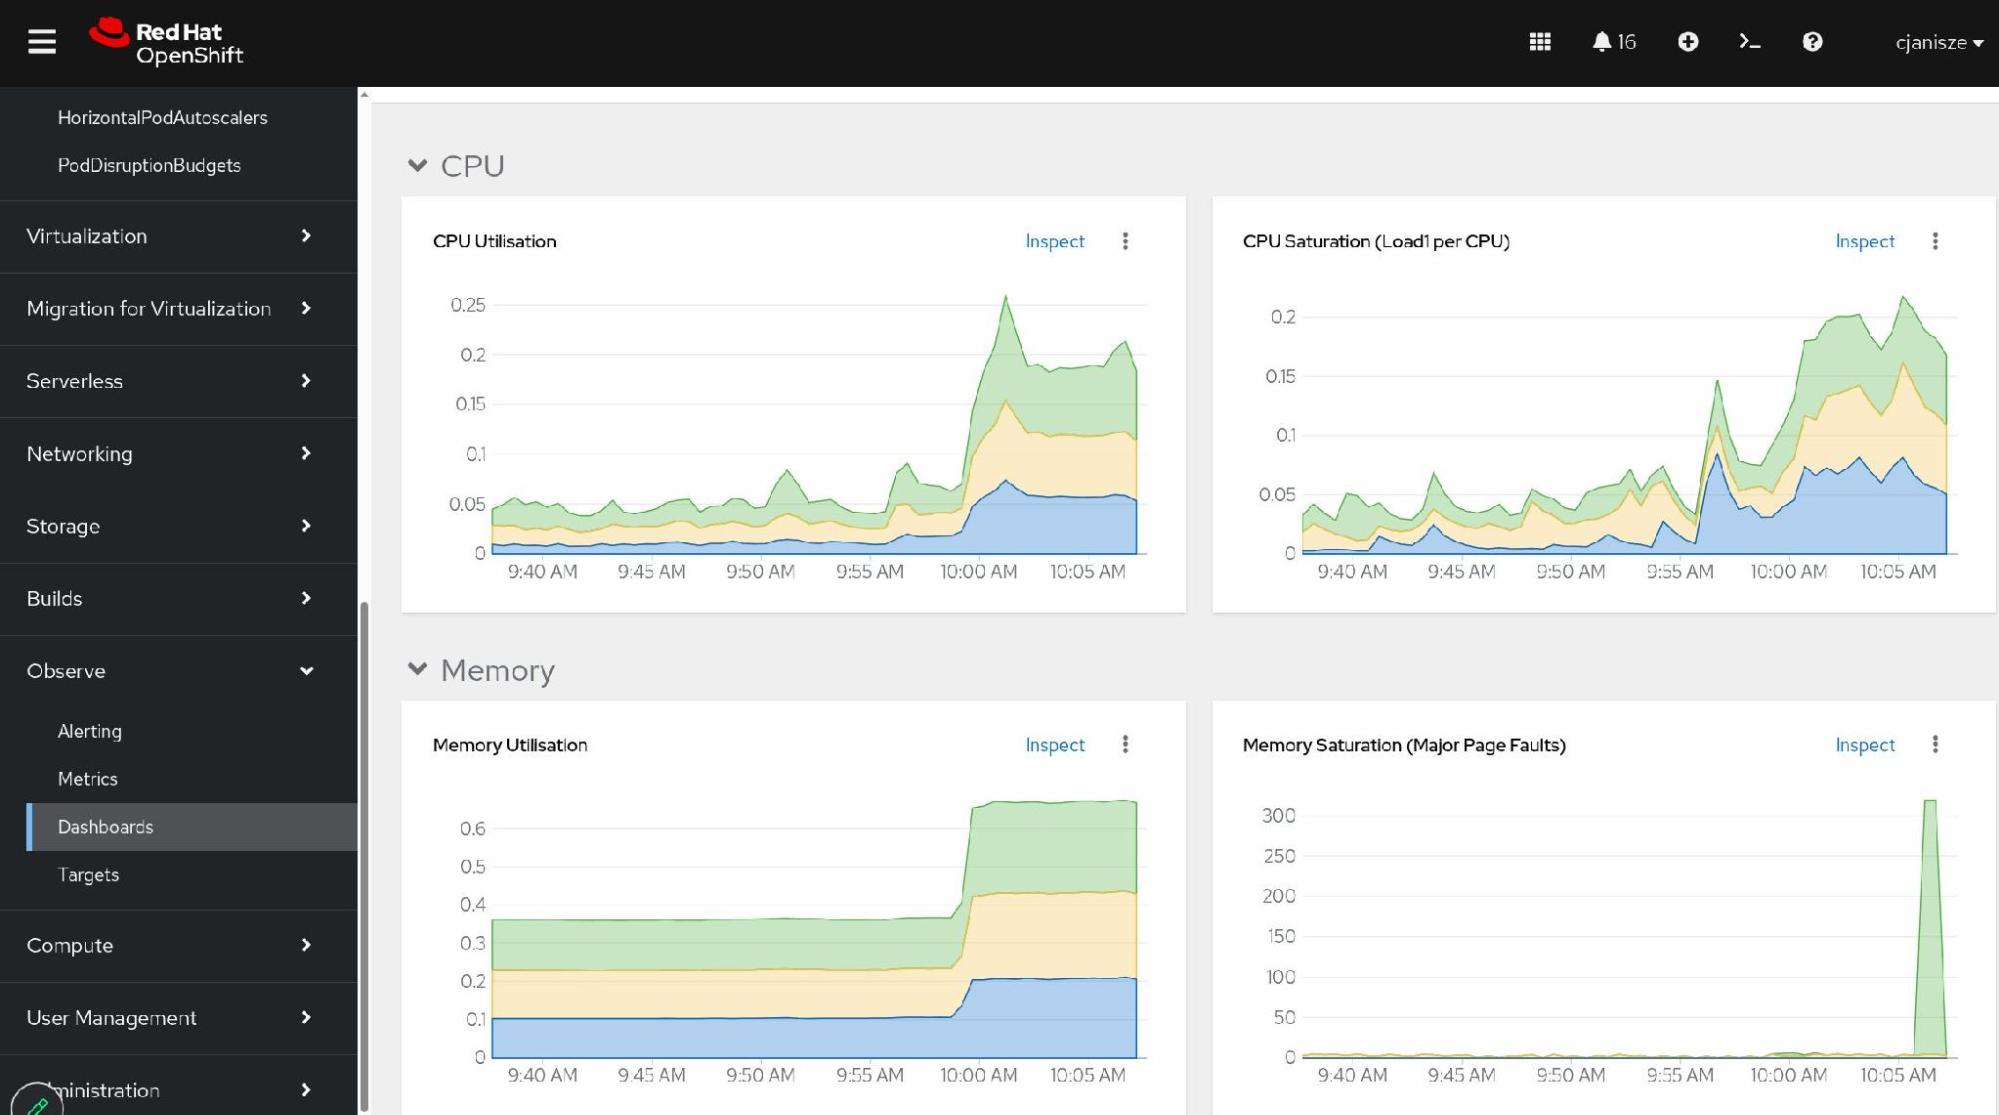
Run the get status command in the Kove management console to view cluster-level CPU and memory utilization (Node exporter / USE method) during the baseline run:
> get status
================================== MC Info ==================================
Name: mc-2205901914343          IP: 172.22.3.102            Version: 2.1.2.s.1
Uptime: 1 days, 23:32           Health: green               Fabric Type: RoCE
================================ Memory Pool ================================
___XPD Mode____|________Available________|________Used________|________Total____
| Active       |   1.717 TiB (81.3%) |  405.000 GiB (18.7%) |   2.112 TiB |
| Maintenance  |          -          |          -          |       -     |
| Reserved     |          -          |          -          |       -     |
-----------------------------------------------------------------------------
| All          |   1.717 TiB (81.3%) |  405.000 GiB (18.7%) |   2.112 TiB |
~~~~~~~~~~~~~~~~~~~~~~~~~~~~~~~~~~~~~~~~~~~~~~~~~~~~~~~~~~~~~~~~~~~~~~~~~~~~~
Allocations: 45
=================================== XPDs ====================================
       Active: 3                Maintenance: 0             Reserved: 0
================================== License ==================================
Status: License active
Expiration Date: 2026-10-17 00:00 UTC
Licensed Total Capacity Limit: 2304 GiB
Current Total Memory Capacity: 2162.809 GiB
=============================================================================
Run the kove_manage list and kove_manage capacity commands to inspect memory saturation (major page faults) during the baseline run, which remained near zero, as expected without Kove:
sh-4.4# kove_manage list
Device    Allocation ID    Size    Status
xpda    80b9b9a9-0818-44b8-b514-ea8031ae74c7    9663676416    OK
xpdb    edee98aa-c124-4dc0-81ea-90be6d98e668    9663676416    OK
xpdc    52863fe0-4061-4fb7-ba45-2c6ac0b759ad    9663676416    OK
xpdd    ab5b53be-ce2f-4a54-ad34-8182324527c8    9663676416    OK
xpde    521f24ca-b786-4ded-87da-8e8b6153fad2    9663676416    OK
xpdf    a4a82656-54cc-455d-8308-12ad6096c9a1    9663676416    OK
xpdg    4f32fccc-39f2-4044-8446-9f421070e06c    9663676416    OK
xpdh    0dddb257-9594-4d30-bc9b-63c0662b8e0f    9663676416    OK
xpdi    463abd27-d260-4676-abcc-3909295d1e0f    9663676416    OK
xpdj    984d1347-0b4b-49d6-9616-e602d78595dd    9663676416    OK
xpdk    043683b7-7b71-4d57-8cf7-17bbaa67cf5f    9663676416    OK
xpdl    232458ea-3277-459c-b4e4-89b0ba499448    9663676416    OK
xpdm    5b837100-7b59-4cd9-b80d-4c62fd8819b9    9663676416    OK
xpdn    00b5e301-c198-4402-b56c-27b1e7cadf2d    9663676416    OK
xpdo    715a8578-c08d-424f-a7e9-ff108296e7c7    9663676416    OK
sh-4.4# kove_manage capacity
Total Capacity: 2322298044416
Available Capacity: 1887432605696
sh-4.4#| Metric | Run 1: Baseline (No Kove) |
|---|---|
| Classifier pods running | 45 / 45 |
| Objects processed in 1 hour | 20,434 |
| Namespace memory (from requests) | 294% |
| Namespace memory (from limits) | 46% |
| sim-classifier total RSS | ~228 GiB |
| Kove:SDM in use | No |
| Major page faults | Near zero |
Run 2: Extending memory with Kove:SDM (45 classifiers)
The second test repeated the identical workload while enabling Kove:SDM. No application code changes were made, no container image changes were required, and no manifest modifications beyond memory enablement were necessary. The same sim-classifier image ran unchanged.
The Kove Management Console showed 45 active allocations (one per classifier pod) and 405 GiB consumed from the 2.112 TiB pool (18.7%). The major page fault rate went up noticeably compared to the baseline run, confirming Kove was actively serving pages rather than the workload running entirely in local DRAM.
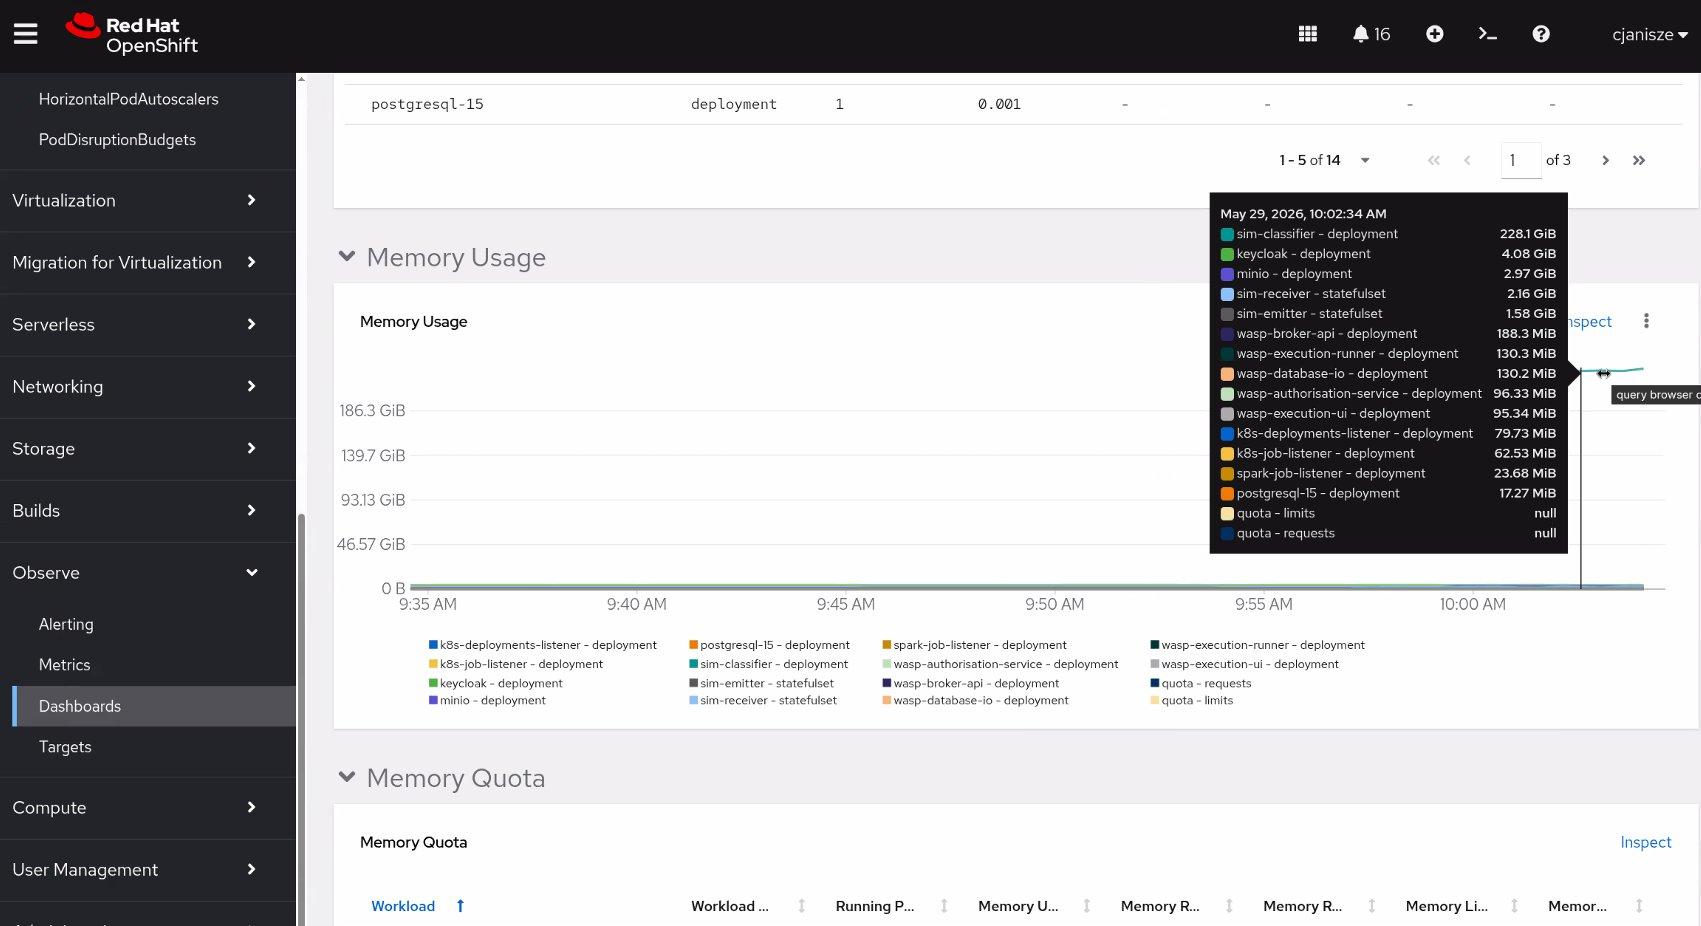
The breakdown in Figure 8 confirms that the classifier deployment represents the vast majority of memory consumed.
Run the kove_manage l4_stats command to view Kove L4 cache statistics for device xpda (current cache 4.978 GiB, max reached 5.394 GiB):
sh-4.4# kove_manage l4_stats -h xpda
Statistic                                    Pages            Bytes
Current L4 cache size           :          1304957        4.978 GiB
Maximum L4 cache size           :          1414098        5.394 GiB
L4 cache size limit             :          1749214        6.673 GiB
Memory unmapped                 :                0          0.000 B
Memory reclaimed                :                0          0.000 B
Unmap worker high water mark    :          1578665        6.022 GiB
Unmap worker low water mark     :          1545897        5.897 GiB
Reclaim worker high water mark  :          1661753        6.339 GiB
Reclaim worker low water mark   :          1596217        6.089 GiB
Encountered unevictable memory  :                0          0.000 B
sh-4.4#
When Kove:SDM is enabled, the namespace dashboard metrics shown in Figure 9 indicate consistent resource limits and overall cluster stability.
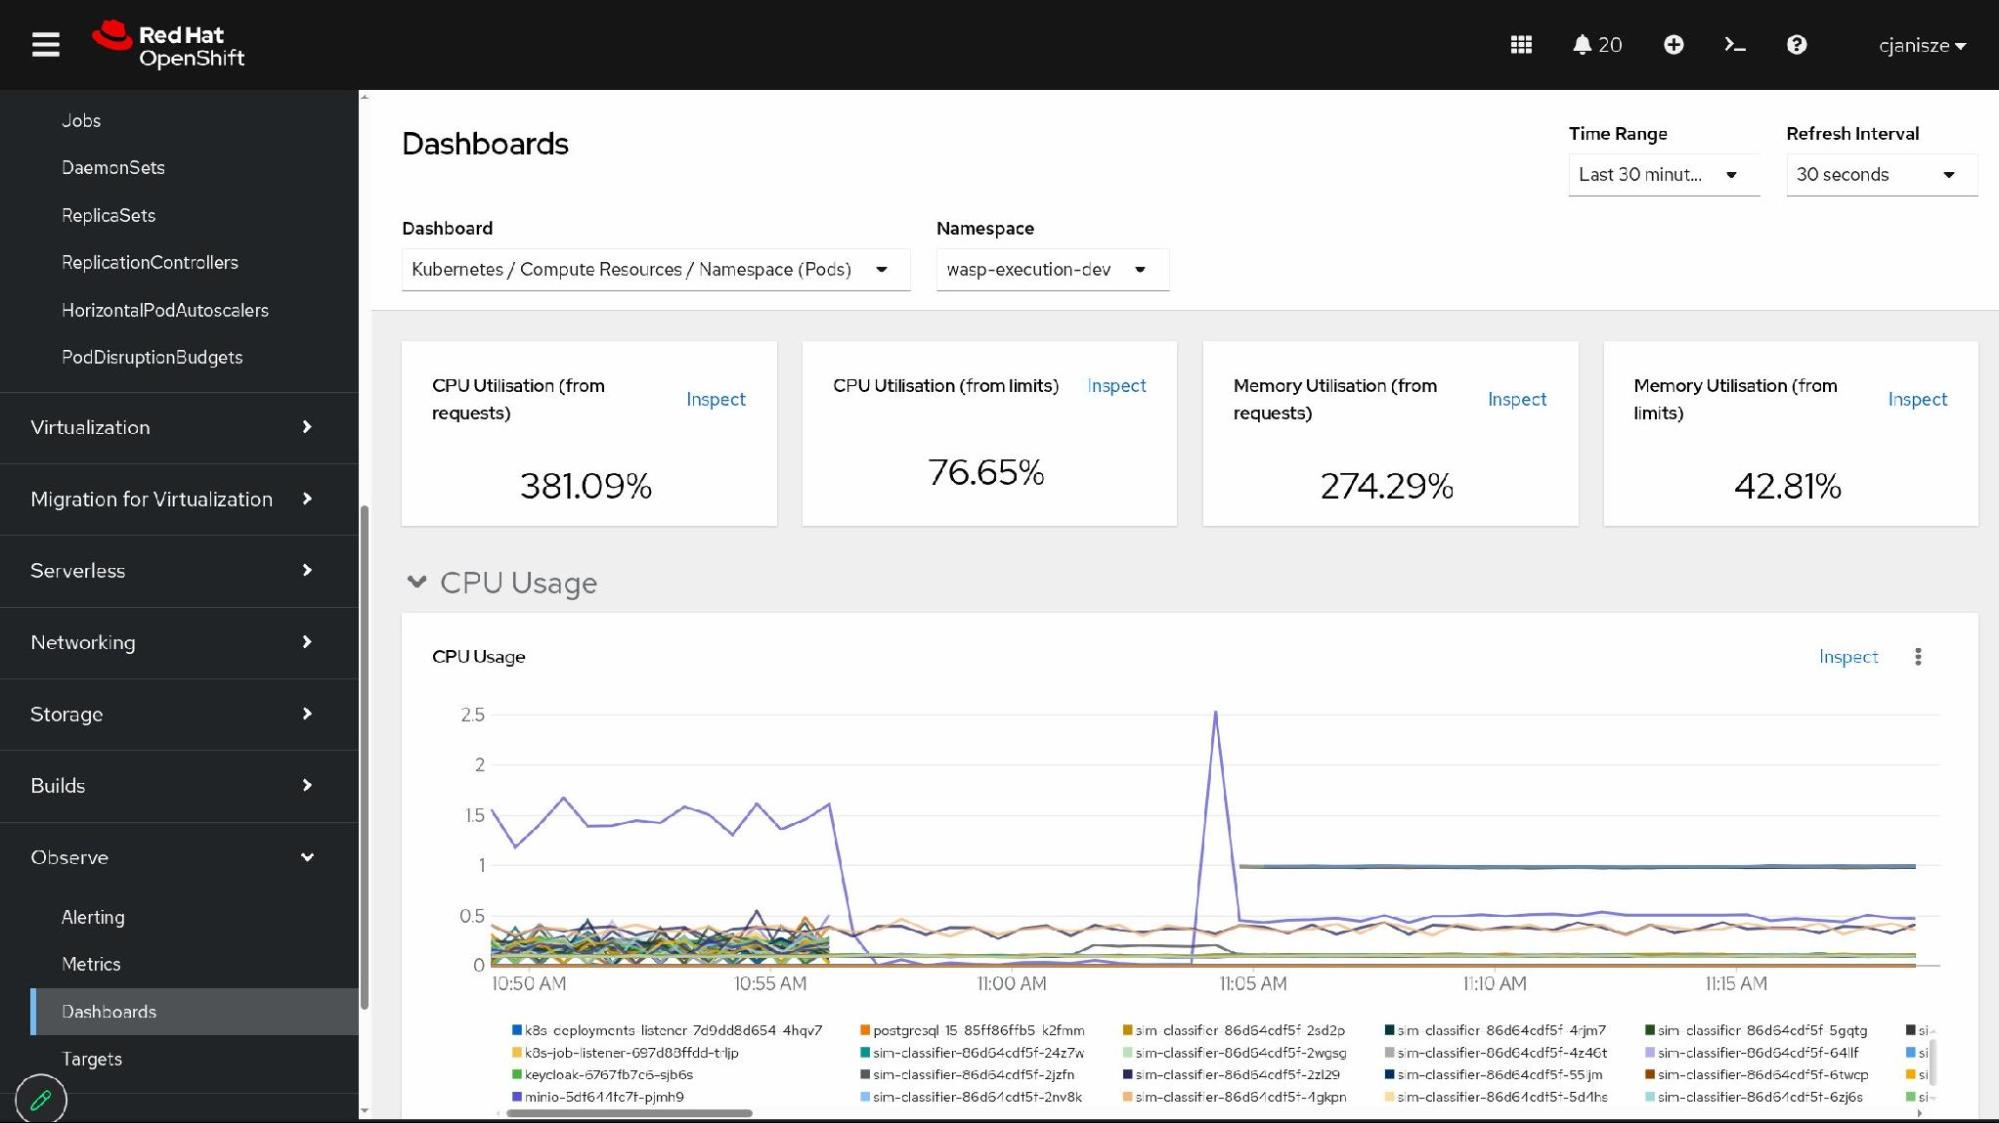
Figure 10 illustrates the spike in major page faults, confirming that the Kove memory pool is actively serving pages without affecting CPU stability.
| Metric | Run 2: With Kove (45 classifiers) |
|---|---|
| Classifier pods running | 45 / 45 |
| Objects processed in 1 hour | 34,159 |
| vs baseline | +67% more objects processed (synthetic data—see notes) |
| Kove:SDM memory consumed | 405 GiB (18.7% of 2.112 TiB) |
| Kove allocations | 45 |
| Major page faults | Elevated; Kove actively serving pages |
| Application changes | None |
Run 2 processed more objects than Run 1: 34,159 versus 20,434. It is worth acknowledging that difference rather than dismissing it. At the same time, this was entirely synthetic data, the test was not designed as a rigorous throughput benchmark, and there are factors (such as MinIO disk I/O, workload timing, data volume in the bucket at trigger time) that can shift object counts between runs. What we can say with confidence is that the classifiers running from Kove-backed memory produced no errors, no pod restarts, and no signs of degradation or latency. The workload ran correctly. Whether Kove contributed to the throughput difference or whether it is test variation is something a more controlled follow-up test would need to answer.
Run 3: Scaling beyond physical memory limits (225 classifiers)
The most significant validation occurred during the third test. The cluster was scaled from 45 classifier pods to 225—a 5 times increase in workload density. Without memory extension, this configuration would require approximately 1.1 TiB of application memory, which exceeds the cluster's 768 GB of physical DRAM and cannot be achieved using native resources alone.
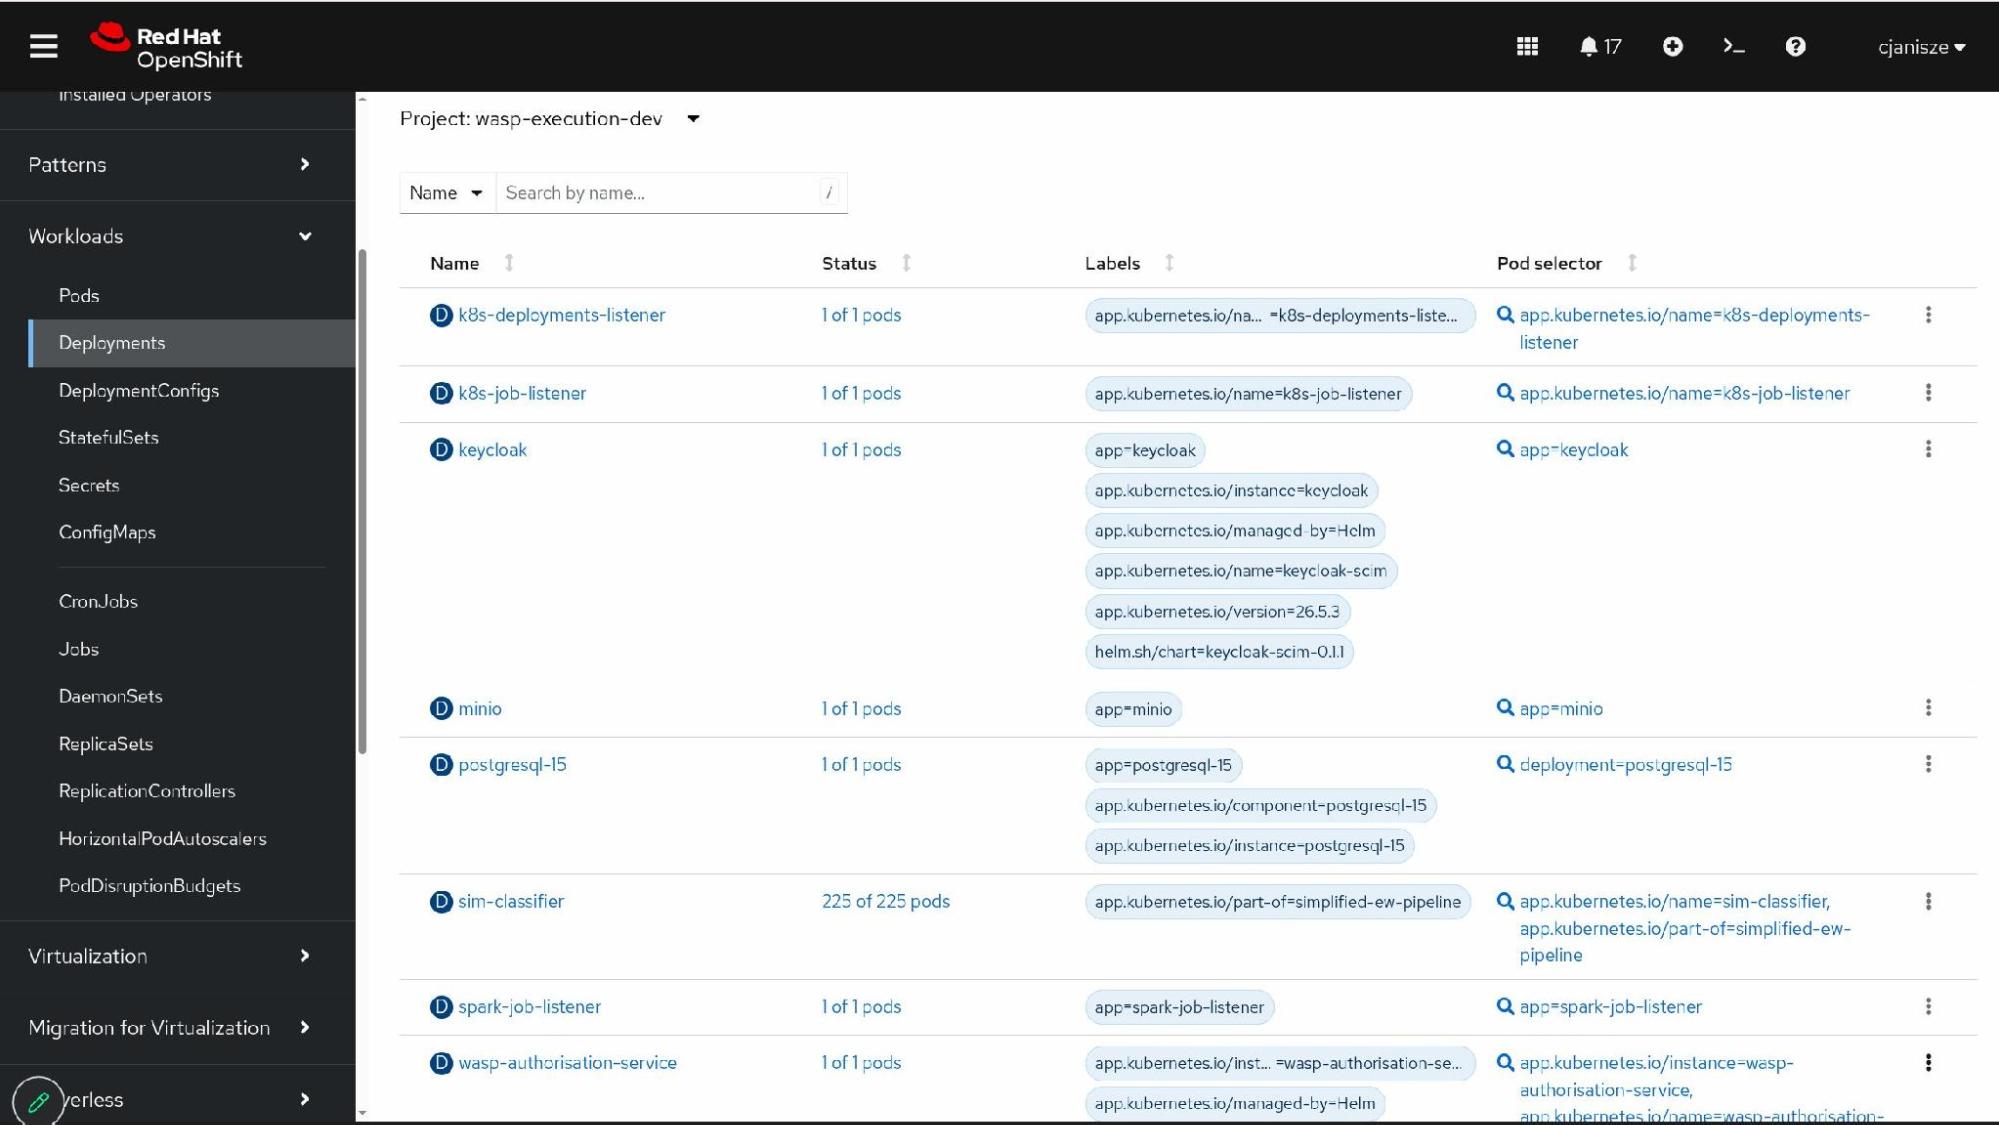
Scaling the workload fivefold to 225 classifier pods is verified in Figure 11.
Run the get status command in the Kove management console to view memory pool status during the 225-classifier run, showing 1.978 TiB consumed (93.7%), 225 allocations, and 137 GiB remaining:
> get status
================================ MC Info ================================
Name: mc-2205901914343          IP: 172.22.3.102            Version: 2.1.2.s.1
Uptime: 2 days, 00:46           Health: green               Fabric Type: RoCE
============================ Memory Pool ============================
____XPD Mode____ _______Available_______ _______Used_______ _______Total____
| Active        | 137.809 GiB (6.4%) |  1.978 TiB (93.7%) |  2.112 TiB |
| Maintenance   |         -          |         -          |      -     |
| Reserved      |         -          |         -          |      -     |
-------------------------------------------------------------------------
| All           | 137.809 GiB (6.4%) |  1.978 TiB (93.7%) |  2.112 TiB |
~~~~~~~~~~~~~~~~~~~~~~~~~~~~~~~~~~~~~~~~~~~~~~~~~~~~~~~~~~~~~~~~~~~~~~~~~
Allocations: 225
================================ XPDs ================================
          Active: 3           Maintenance: 0             Reserved: 0
================================ License ================================
Status: License active
Expiration Date: 2026-10-17 00:00 UTC
Licensed Total Capacity Limit: 2304 GiB
Current Total Memory Capacity: 2162.809 GiB
=========================================================================
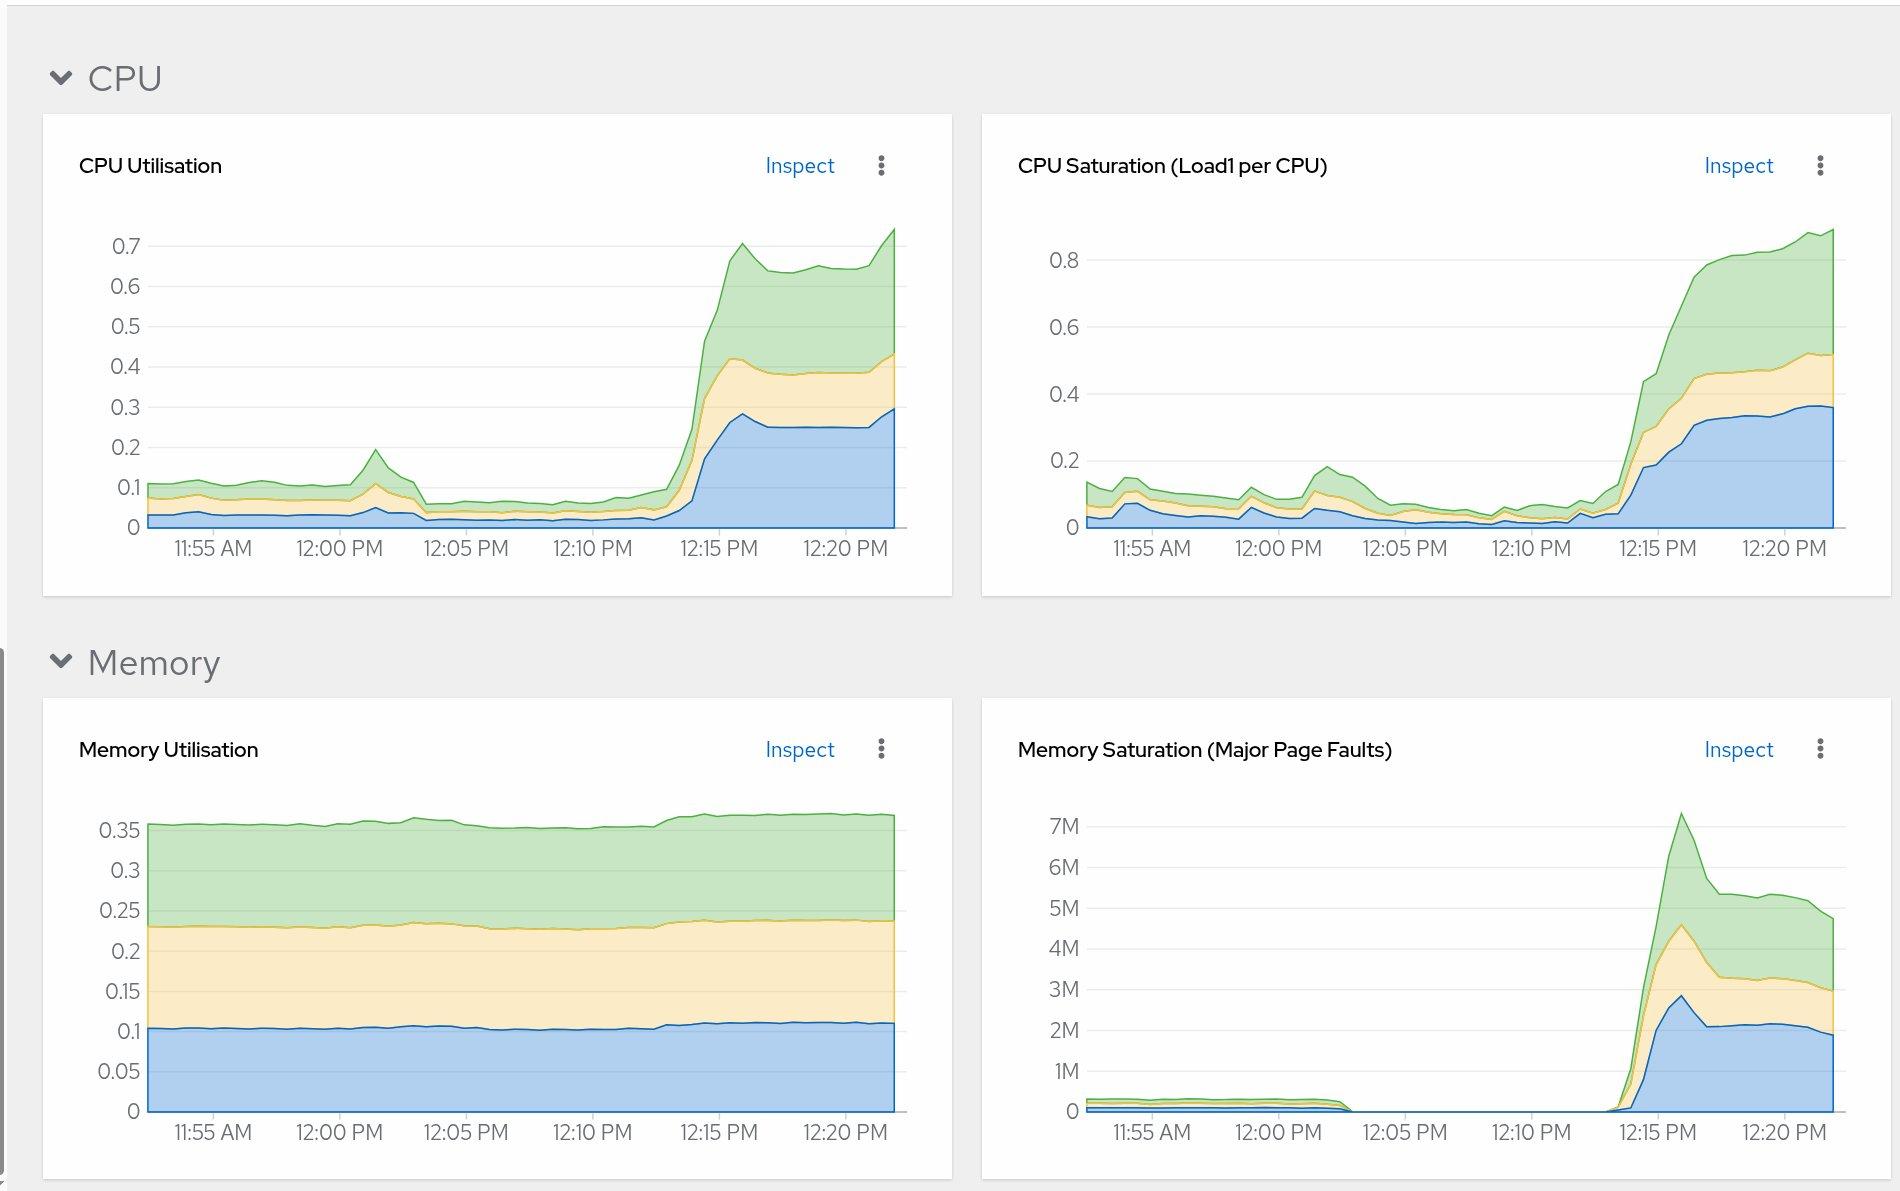
As shown in Figure 12, scaling to 225 pods causes major page faults to peak at 7 million while maintaining full pod availability.
Finally, Figure 13 captures a mid-run classifier reset and subsequent seamless memory recovery back to peak utilization.
| Metric | Run 3: Kove (225 classifiers) |
|---|---|
| Classifier pods running | 225 / 225 |
| Scale vs. baseline | 5 times |
| Kove:SDM consumed | 1.978 TiB (93.7%) |
| Kove remaining | 137.809 GiB (6.4%) |
| Allocations | 225 |
| XPDs active | 3 |
| Major page faults at peak | ~7 million |
| Application changes | None |
At 225 classifiers, 93.7% of the Kove pool was in use. Page fault rates peaked around 7 million, which is much higher than the 45-classifier runs, reflecting the heavier paging activity as more pods pulled data from the Kove fabric simultaneously. All pods remained running and stable throughout. The OpenShift cluster successfully hosted approximately 2.7 times more memory than physically existed in the environment.
Results at a glance
| Run 1: No Kove | Run 2: Kove (45) | Run 3: Kove (225) | |
|---|---|---|---|
| Classifier pods | 45 | 45 | 225 |
| Objects / hour | 20,434 | 34,159 (+67%—see notes) | Not measured (scaling test) |
| Kove memory used | — | 405 GiB | 1.978 TiB |
| % of Kove pool | — | 18.7% | 93.7% |
| App changes needed | N/A | None | None |
| All pods stable | Yes | Yes | Yes |
Observations
Here is what we observed during the WASP EW pipeline tests on Red Hat OpenShift 4.18.
Integration was consistent and direct
Kove:SDM integration required no changes to application container images, manifests, or code. The same sim-classifier image ran unchanged across all three tests. From the workload's perspective, there is nothing different. Memory allocation behaves normally and the Kove layer is completely transparent. This was the primary capability we wanted to validate, and it held up throughout.
Throughput: More objects with Kove, within test limitations
On the throughput question: Run 2 processed more objects than Run 1 (34,159 versus 20,434). The Kove-backed run performed better, but because the test used synthetic data and was not designed as a controlled throughput benchmark, we cannot claim with certainty that Kove was solely responsible for the difference. That said, we are not dismissing the number either. What we can say clearly is that the classifiers ran correctly, stably, and with no errors or degradation when backed by Kove memory, which is the primary thing this test was designed to show.
Scale
225 concurrent classifier pods consuming 1.978 TiB of Kove memory demonstrates capacity clearly. The cluster has 768 GB of physical RAM; the workload consumed roughly 2.7 times that. All 225 pods ran stably throughout, the Kove fabric served page faults without issue, and no pods were evicted or restarted.
Why this matters for OpenShift AI workloads
As organizations adopt Red Hat AI, IBM watsonx, machine learning pipelines, vector databases, retrieval-augmented generation (RAG), and large-scale analytics platforms, memory requirements continue to increase. Common workloads facing this challenge include:
- Large vector indexes
- Knowledge graph processing
- AI inference workloads
- Entity-resolution systems
- Electronic warfare analytics
- Real-time classification engines
A memory-first architecture addresses these challenges in four ways:
- Run denser workloads on existing hardware: Instead of purchasing new servers just to expand RAM capacity, organizations can use their existing infrastructure far more efficiently.
- Reclaim stranded memory resources: Pooling underutilized memory from across the datacenter turns isolated capacity into a shared resource accessible to any workload.
- Maintain application compatibility out of the box: Red Hat OpenShift workloads continue to run smoothly without code rewrites or container image modifications, lowering operational risk.
- Strengthen sovereign infrastructure strategies: Teams can scale AI and analytics environments while maintaining full control over data residency, governance, and compliance boundaries.
Building sovereign AI infrastructure on open technologies
The broader architecture extends beyond memory disaggregation. An integrated stack of technologies—including Red Hat OpenShift, IBM watsonx, IBM Cloud Pak for Data, and Kove:SDM—provides a foundation for sovereign AI environments that prioritize open architectures, data ownership, governance, auditability, and operational independence.
In these environments, organizations can deploy compute resources where data resides, enabling federated operations across data centers, edge locations, and disconnected environments while maintaining centralized governance and policy control.
For organizations facing increasing AI workloads and growing memory demands, the combination of OpenShift and software-defined memory offers a practical approach that solves the actual bottleneck many workloads face today: memory.
Conclusion
The WASP EW Pipeline validation demonstrated that software-defined memory can operate transparently within Red Hat OpenShift while enabling workload densities that exceed native physical memory limits. Across all tests:
- Applications required no code modifications.
- Container images remained unchanged.
- OpenShift operations remained consistent.
- Workloads remained stable under significant memory pressure.
Most importantly, the environment scaled from 45 classifier pods to 225 classifier pods while consuming nearly 2 TiB of memory from a shared software-defined memory pool. As AI and analytics workloads continue to push infrastructure beyond traditional architectural boundaries, memory-first designs built on Red Hat OpenShift represent a compelling approach for organizations seeking greater scalability, efficiency, and sovereignty without sacrificing openness or operational simplicity.
Acknowledgments
Red Hat and Kove would like to acknowledge the following contributors for their work during this validation:
- Indraneel Acharya, Delivery Manager, Kove
- Jesse Taylor, Developer, Kove
- Frank Williams, Director of Sales & Marketing, SRC UK Ltd.
Note
Kove and Kove:SDM are trademarks of Kove IO, Inc. in the United States.

