When organizations scale their AI initiatives, the most challenging question isn't "Does the model work?" but "How do we track model usage for accurate chargeback, and do we have the capacity for tomorrow's workload?" Lack of visibility into consumption is a critical blocker for effective cost attribution and capacity planning.
Red Hat OpenShift AI 3.4 directly addresses the immediate need for visibility into model consumption. It introduces a new usage dashboard (Figure 1) that appears in the OpenShift AI console when you deploy Models-as-a-Service (MaaS), and provides administrators with usage tracking and oversight of API calls and token consumption for their managed AI models.
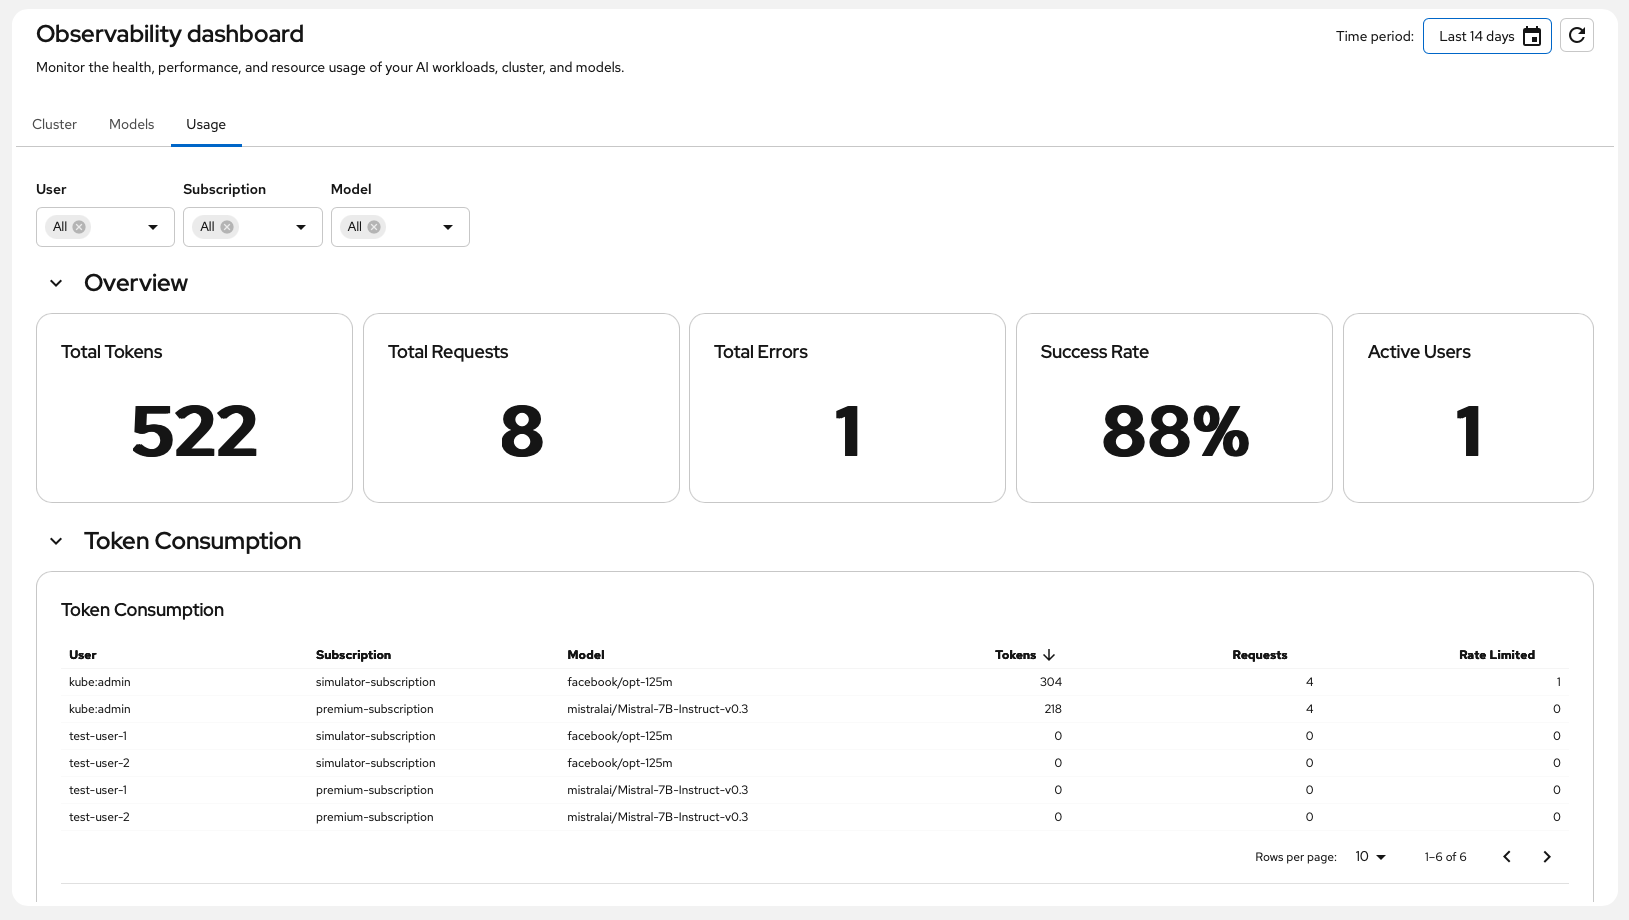
The usage dashboard provides the data necessary to monitor model consumption and manage resources:
- Granular usage data: View detailed consumption metrics including token consumption, total API requests, and rate-limited calls.
- Drill-down views: Filter usage data by subscription, user, and model within a sortable and filterable table.
- Time-based filtering: Analyze usage trends over specific time frames using filters for one hour, 24 hours, three days, seven days, 14 days, or one month.
- Real-time status: The dashboard shows high-level "box metrics," displaying Total Tokens, Total Requests, Total Errors, Success Rate, and Active Users.
- Export for finance: The export function for usage data provides a basis for preliminary chargeback and cost attribution. (Note: Administrators should review the limitations mentioned later in this article regarding long-term retention and accuracy for official billing purposes.)
Tracking MaaS usage in the technology preview
The usage dashboard is introduced as a technology preview in Red Hat OpenShift AI 3.4. While it provides valuable information for showback, it also has limitations that we are actively working on. The main one is the cardinality risk that stems directly from the current architecture, which relies on Prometheus metrics.
Figure 2 depicts the successful flow of an inference call through MaaS. The process starts when a request from a client or an agent reaches the Istio Gateway.
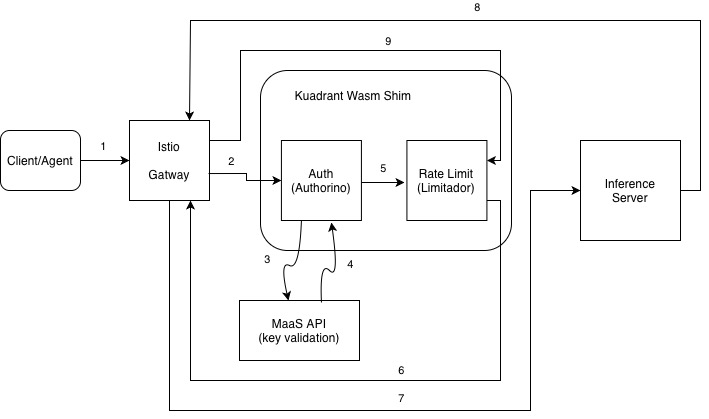
The Gateway passes the request to Kuadrant, the open source project providing API gateway technology within Red Hat Connectivity Link, where the flow proceeds through two components:
- Authorization: Authorino authenticates the user and authorizes the request via the MaaS API, which validates its API key.
- Rate limiting: Once authorized, the request proceeds to the rate limiter Limitador, which checks the request count against the predefined subscription limit. If the limit is exceeded, an HTTP
429 Too Many Requestserror is returned immediately to the client.
If the request is authorized and within the defined limits, it is routed back through the Istio Gateway to the inference server (running the LLM). The final response from the inference server returns through the Istio Gateway and Kuadrant back to the client.
Limitador exposes three counters that track usage metrics during this process:
authorized_callstracks successful API calls.rate_limitedtracks API calls that exceed the defined limit.authorized_hitsquantifies the consumed tokens.
To achieve user-level tracking, we apply labels to the metrics stream of Limitador. The following example shows the TelemetryPolicy used for injecting these labels:
apiVersion: extensions.kuadrant.io/v1alpha1
kind: TelemetryPolicy
metadata:
  name: maas-telemetry
  namespace: openshift-ingress
  labels:
    app.kubernetes.io/part-of: maas-observability
spec:
  metrics:
    default:
      labels:
        model: responseBodyJSON("/model")
        user: auth.identity.userid
        # Subscription metadata for usage attribution and billing
        subscription: auth.identity.selected_subscription
        organization_id: auth.identity.subscription_info.organizationId
        cost_center: auth.identity.subscription_info.costCenter
  targetRef:
    group: gateway.networking.k8s.io
    kind: Gateway
    name: maas-default-gateway
This is a relatively straightforward way to get the usage information. However, a large number of unique combinations of the labels (high cardinality) generates a massive amount of time series data stored in Prometheus that can potentially strain Prometheus resources and negatively affect its overall performance. Thus, these user-specific labels are only applied when an option to capture user information, which is disabled by default, is set in Models-as-a-Service. Before enabling this option, OpenShift AI administrators need to consider whether Prometheus can cope with the number of users, subscriptions, and models in their environment.
In addition to the potential high cardinality risk, the underlying use of Prometheus metrics introduces several other implications that can limit its suitability for precise chargeback and billing:
- Data accuracy: Usage numbers can be inconsistent. Since Prometheus uses extrapolation and aggregation, the reported consumption can in some extreme cases be lower (missing initial calls in a time range) or higher (overcharging due to extrapolation) than the real usage.
- Data retention: Prometheus is not intended for keeping data for a long time. Its default retention time of 15 days is insufficient for a full monthly billing cycle, which means that either the data would need to be queried more often or the retention time would need to be longer, requiring more storage space.
- Data granularity: We might lack call-level granularity of the usage data due to the fact that aggregated values are being polled at a certain frequency. For example, when two authorized API calls are initiated between two polling cycles, we would only get their aggregated token consumption. Temporary polling interruptions can further reduce data granularity.
What's next? Access logs!
We started working on a major architectural improvement for the usage dashboard, planned for an upcoming Red Hat OpenShift AI release, that would address these limitations of the current solution by transitioning from Prometheus metrics to a structured access log solution.
In the revised architecture, a structured log will be generated at the gateway level for each inference call, instead of relying on metrics generated by Limitador. This log, based on the response from Limitador or the inference server, will capture the call's outcome, whether it was rate limited or authorized, and record the number of consumed tokens for authorized calls, among additional parameters.
While the appearance of the usage dashboard won't necessarily change, gathering the data using logs would help us to resolve the challenges we face with using Prometheus metrics:
- The logs are designed for efficient, long-term storage, successfully bypassing the high cardinality problem at scale and supporting multiple monthly billing cycles.
- The logs provide per-call, event-like information. Because this data is not aggregated, it can be accurately and simply summarized over any time range, directly resulting in superior accuracy in the dashboard and superior granularity.
This approach could potentially simplify the export of usage data to external metering and cost-management systems.
Give it a try
The new usage dashboard, despite its current technology preview status and mentioned limitations, already provides useful data for critical tasks like cost attribution and capacity planning. As we are actively working on improving this feature and addressing the current architectural challenges, we encourage you to explore its features and share your feedback with us.
To get started with the dashboard, Red Hat OpenShift AI administrators must complete the following steps:
- Install the Cluster Observability Operator (COO).
- Enable MaaS observability, ensuring the
spec.telemetry.captureUsersetting is included. Remember to consider the cardinality risk to Prometheus resources before enabling this setting. - Ensure the
spec.dashboardConfig.observabilityDashboardoption is set in the custom resourceOdhDashboardConfig.
Completing these steps will add the usage dashboard to the OpenShift AI console (under Observe & monitor → Dashboard), and calls to your AI models will start appearing there.
To learn more about Models-as-a-Service, read the blog post Scaling enterprise AI: Delivering Models-as-a-Service with Red Hat OpenShift AI 3.4.
To start a 60-day trial of OpenShift AI for your current OpenShift cluster, request it here.

