

OpenJDK has long been a top pick for real-world applications and workloads, chosen for its blend of performance, compatibility, reliability, and observability. For many years, JDK Flight Recorder (JFR) and JDK Mission Control (JMC) have contributed to OpenJDK's success. Until recently, both were commercial features, however, available only for certain users and workloads.
Note: This article has been updated to reflect the Cryostat project's name change from ContainerJFR to Cryostat.
In 2018, JDK Mission Control and JDK Flight Recorder were open-sourced. JDK Flight Recorder is now built into the Java Virtual Machine (JVM) for later releases of OpenJDK 8 and all versions from OpenJDK 11 onward. Open-sourcing these tools brings their power—always-on, near-zero overhead production profiling and monitoring, application-specific custom events, and unified-core JDK analytical tooling—to all JDK users. On the downside, JDK Mission Control and JDK Flight Recorder have emerged into a world rapidly moving toward containerization, which is not the paradigm that they were designed for.
The desktop-only JDK Mission Control application requires developers and administrators to access flight recordings on the local disk. Otherwise, one resorts to a complex and potentially insecure setup to connect directly to applications over Java Management Extensions (JMX) in the cloud. Similarly, the bare-metal-focused JDK Flight Recorder allows JVMs to dump recordings into the local filesystem, but not when the application runs inside a container. In that case, the filesystem is not easily accessible from the outside world, and it isn't possible to retrieve and analyze recordings.
This article introduces Cryostat, a young project on the way to becoming a Red Hat product. Cryostat seeks to bridge the gaps between JDK Flight Recorder in the cloud and end-users at their workstations.
About Cryostat: Formerly named ContainerJFR, Cryostat is a container-native JVM application that acts as a JMX bridge to other containerized JVMs. Cryostat exposes a secure API for producing, analyzing, and retrieving JDK Flight Recorder data from cloud workloads.
Manual Cryostat installation and setup
Installing Cryostat manually is straightforward using the available images on Quay.io. Run the following for a basic installation and product demonstration:
$ podman run -it --rm -p 8181 -e CRYOSTAT_WEB_HOST=0.0.0.0 quay.io/cryostat/cryostat:latest
For a more full-fledged demonstration, you can clone the Cryostat repository and run its smoketest.sh. The following sets up a few containers in a Podman pod for testing and demonstration:
$ git clone https://github.com/cryostatio/cryostat

$ cd cryostat

$ sh smoketest.sh
Cryostat's credentials, in this case, are smoketest:smoketest. The other application’s credentials are admin:adminpass123.
Deploying Cryostat on Red Hat OpenShift
If you have access to Red Hat OpenShift or another Kubernetes cluster, you can use the Cryostat Operator to deploy Cryostat on your cluster:
$ git clone https://github.com/cryostatio/cryostat-operator

$ cd cryostat-operator

$ git checkout v1.0.0

$ oc login # ensure you are logged in to your running OpenShift cluster first

$ make cert_manager # cert-manager is used for SSL/TLS certificates to secure in-cluster traffic

$ make deploy # to directly deploy the Operator in your cluster along with a Cryostat CR, required ServiceAccount and Role/RoleBindings, etc.

$ make deploy_bundle # alternative to make deploy. This will deploy the Cryostat Operator Bundle to your cluster, allowing you to install the Operator from your Administrator view’s OperatorHub panel
Note: If you don’t already have access to an OpenShift or Kubernetes cluster, try Red Hat CodeReady Containers.
Figure 1 shows Cryostat in the OpenShift OperatorHub after we've issued a $ make deploy_bundle.
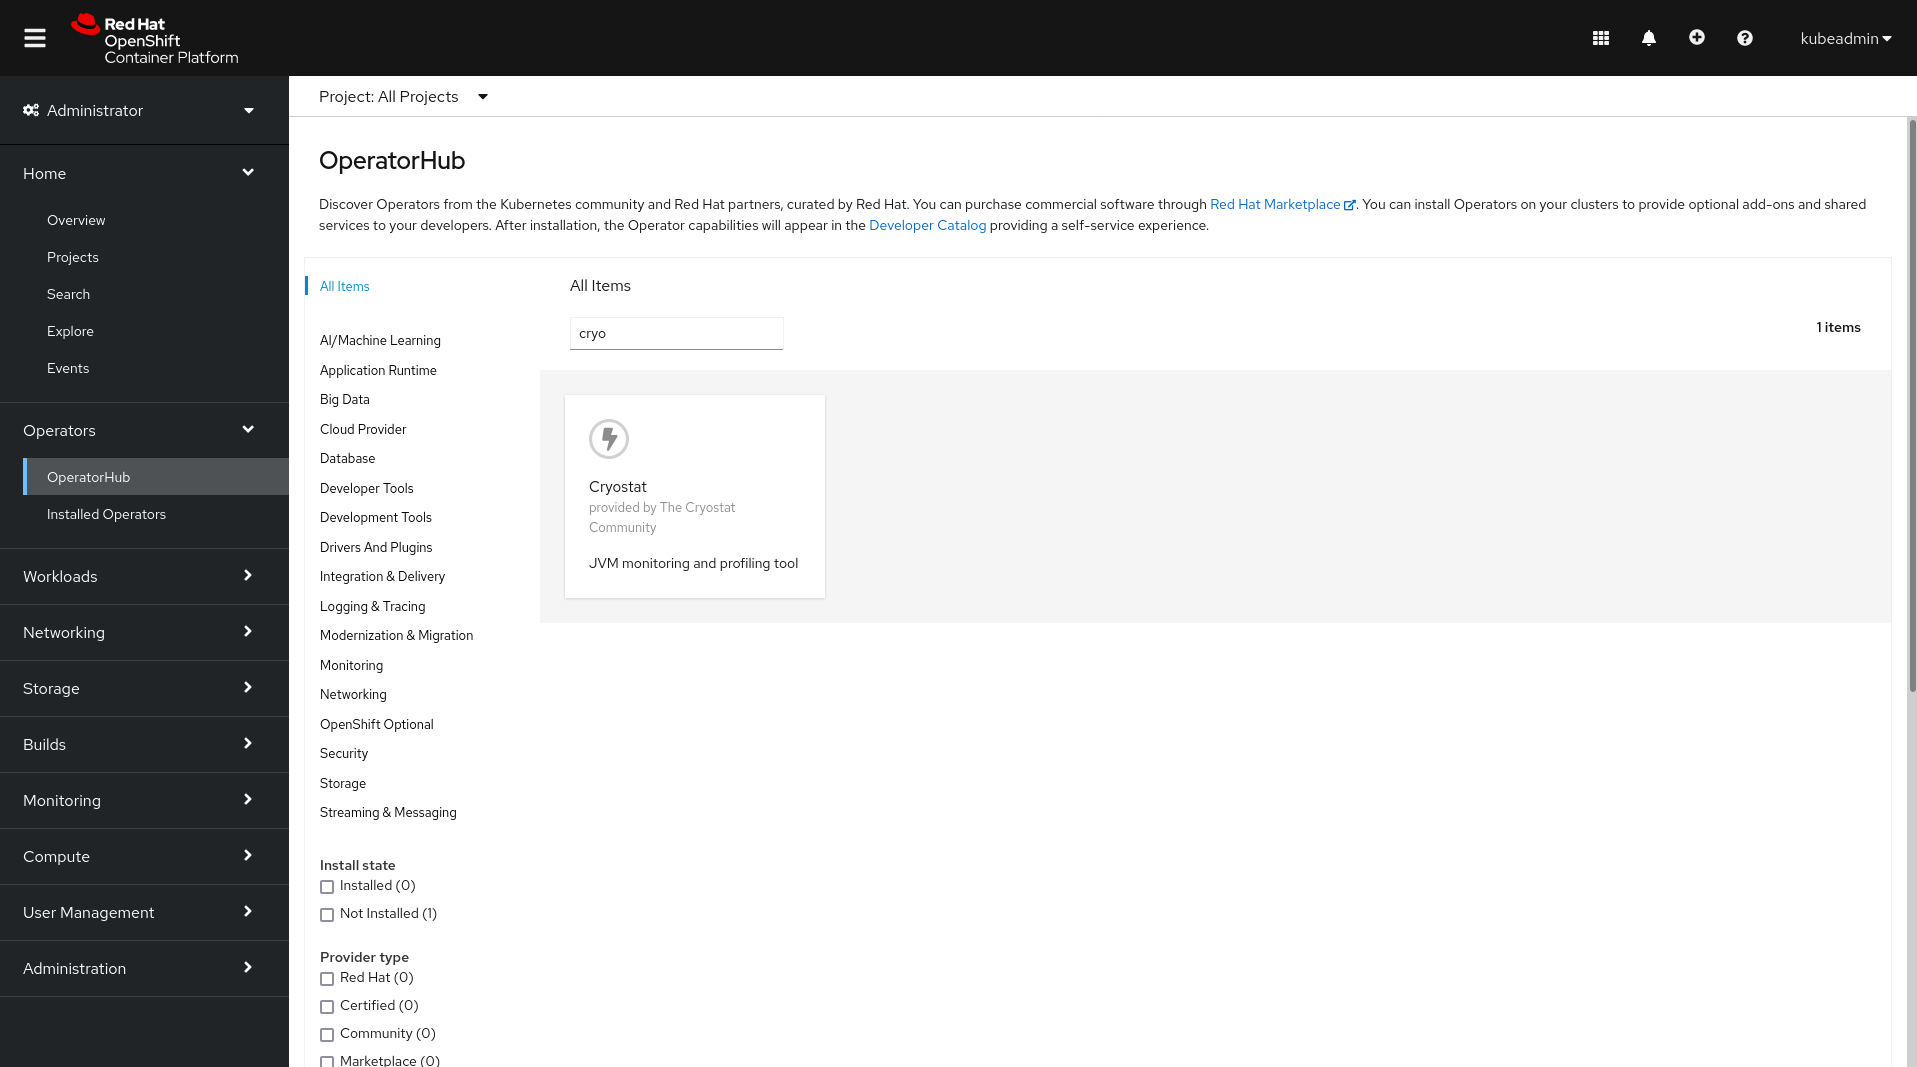
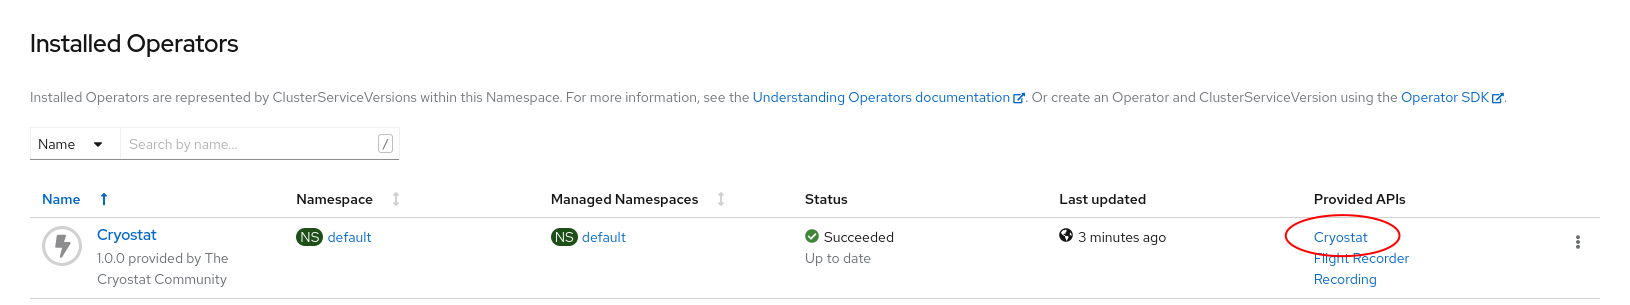
Figure 2 shows a Cryostat instance installed in the default namespace.
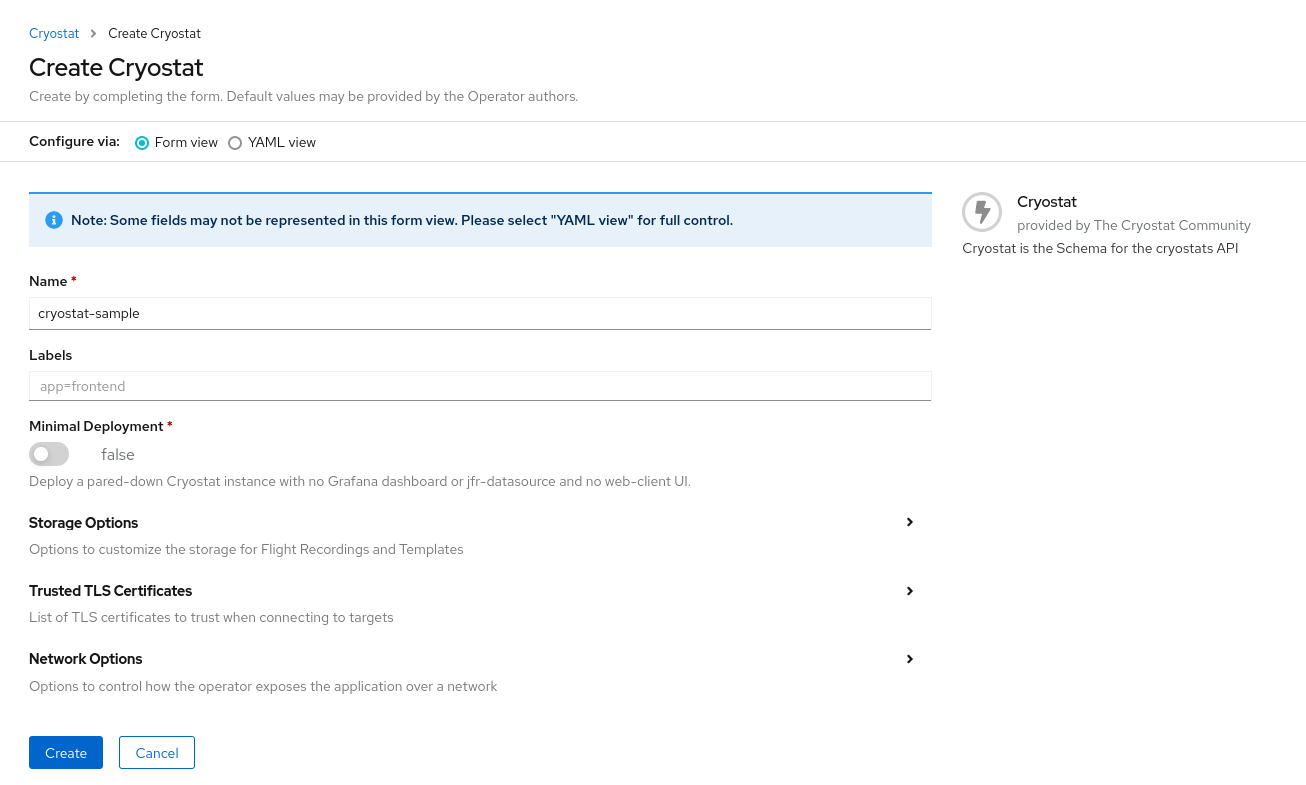
After you've installed Cryostat, create a custom resource for it, as shown in Figure 3. Choose any name you like and leave the minimal setting on false for now.
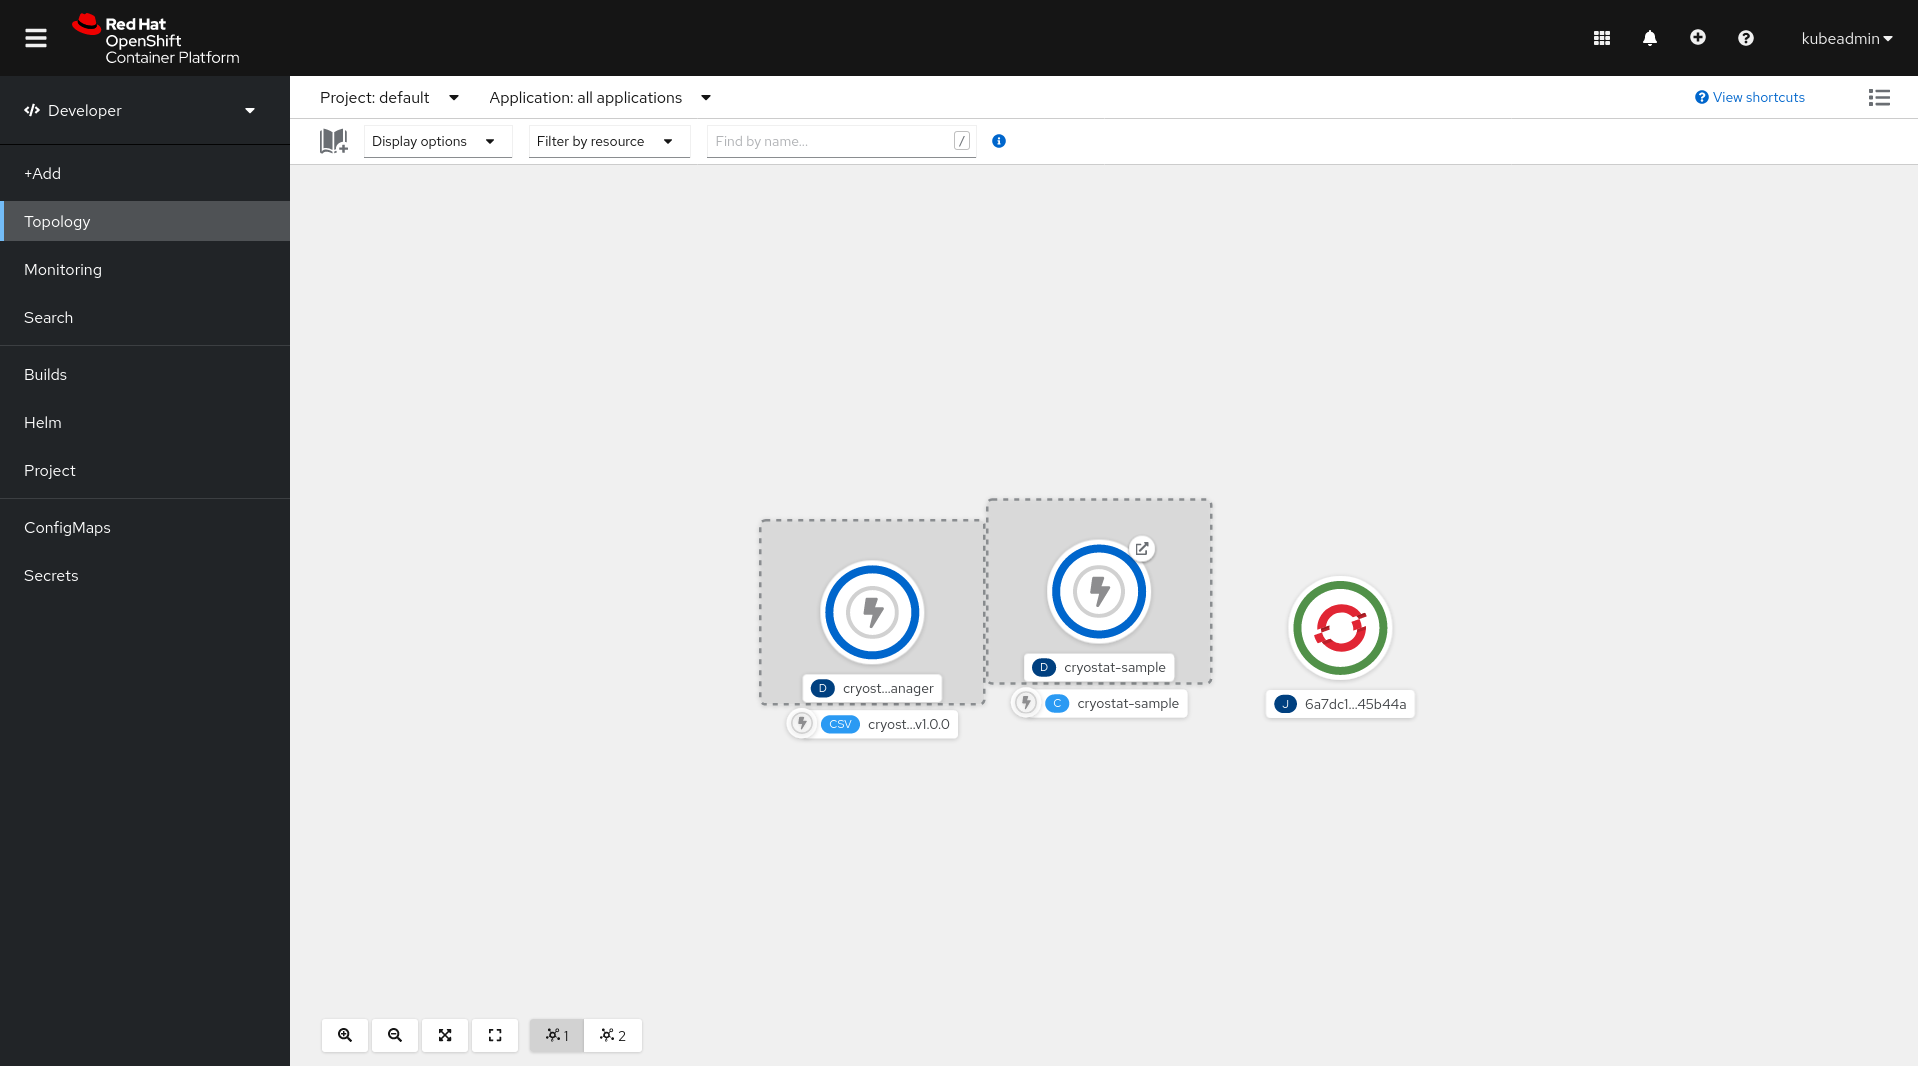
After a short time, the Cryostat Operator finishes deploying Cryostat and its services. You can use any view that shows the exposed route URLs to see the Cryostat web client. Figure 4 shows Cryostat in OpenShift's Topology view.
Next, we'll take a look at Cryostat's major features, and I'll show you how to configure them for your container-managed OpenJDK applications.
Discovery with Cryostat
Cryostat is a containerized JVM that runs as a “sidecar” alongside your OpenJDK applications. Depending on the runtime environment, it automatically selects the best strategy for discovering your JMX-enabled applications. For applications running with docker-compose or podman-compose, Cryostat would use the Java Discovery Protocol. For applications running on Kubernetes or OpenShift, it would use endpoints. These are only examples of the platform implementations Cryostat currently provides. It is easily extensible if you need customized support for a different container platform.
Java Management Extensions
Ensure that your applications have JMX enabled and that the JMX port is published and reachable by Cryostat. In practical terms, this means passing the following JVM flags when you start the application:
-Dcom.sun.management.jmxremote.port=9091 -Dcom.sun.management.jmxremote.rmi.port=9091
Then, expose the port using whatever mechanism your container platform uses. In OpenShift or Kubernetes, you would create a service for your deployment and then add an exposed port to the service. By default, Cryostat uses port 9091 for JMX, but you can use any port number given the port is named jfr-jmx.
Figure 5 shows Cryostat with two sample applications in the OpenShift Topology view.

Java Discovery Protocol
If you are running with Podman or Docker, or if you are running a local JVM process directly on your host machine, you should also enable Java Discovery Protocol:
-Dcom.sun.management.jmxremote.autodiscovery=true
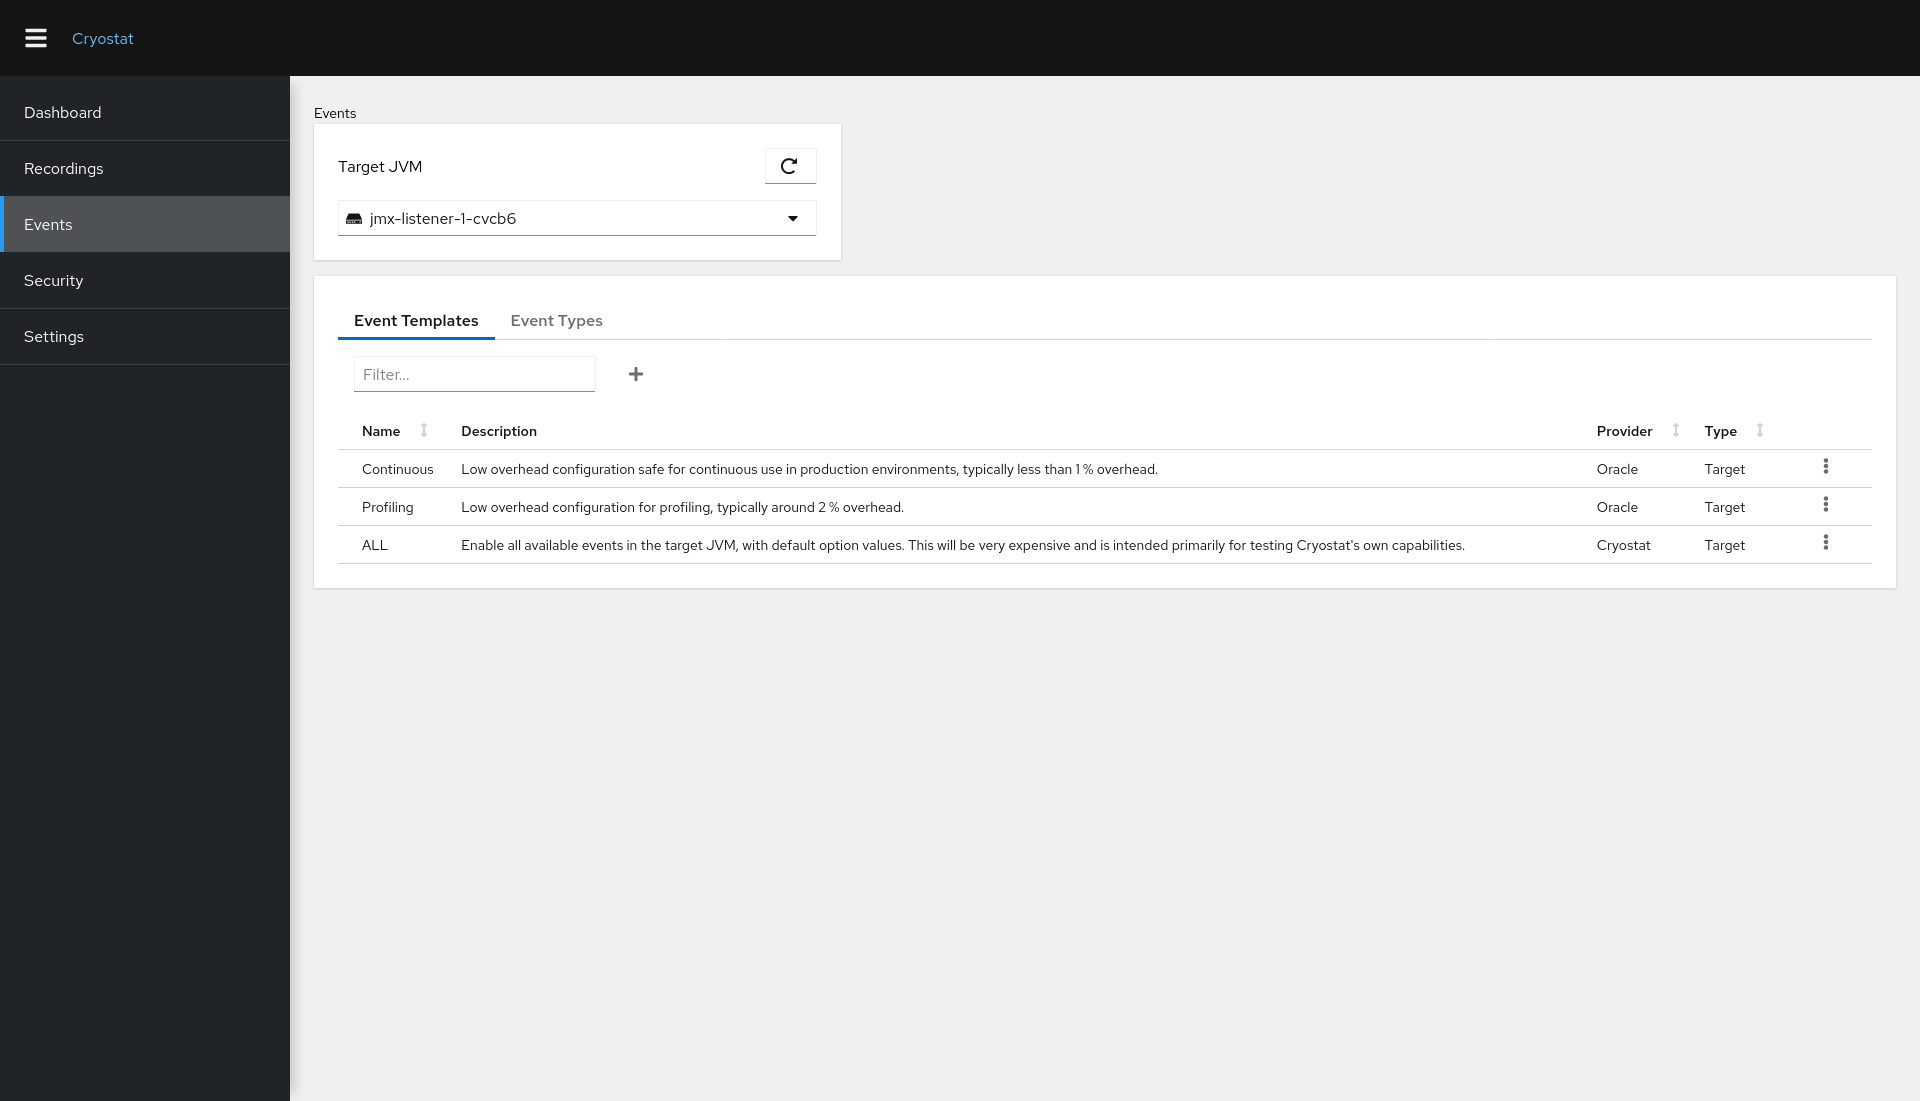
Event templates in Cryostat
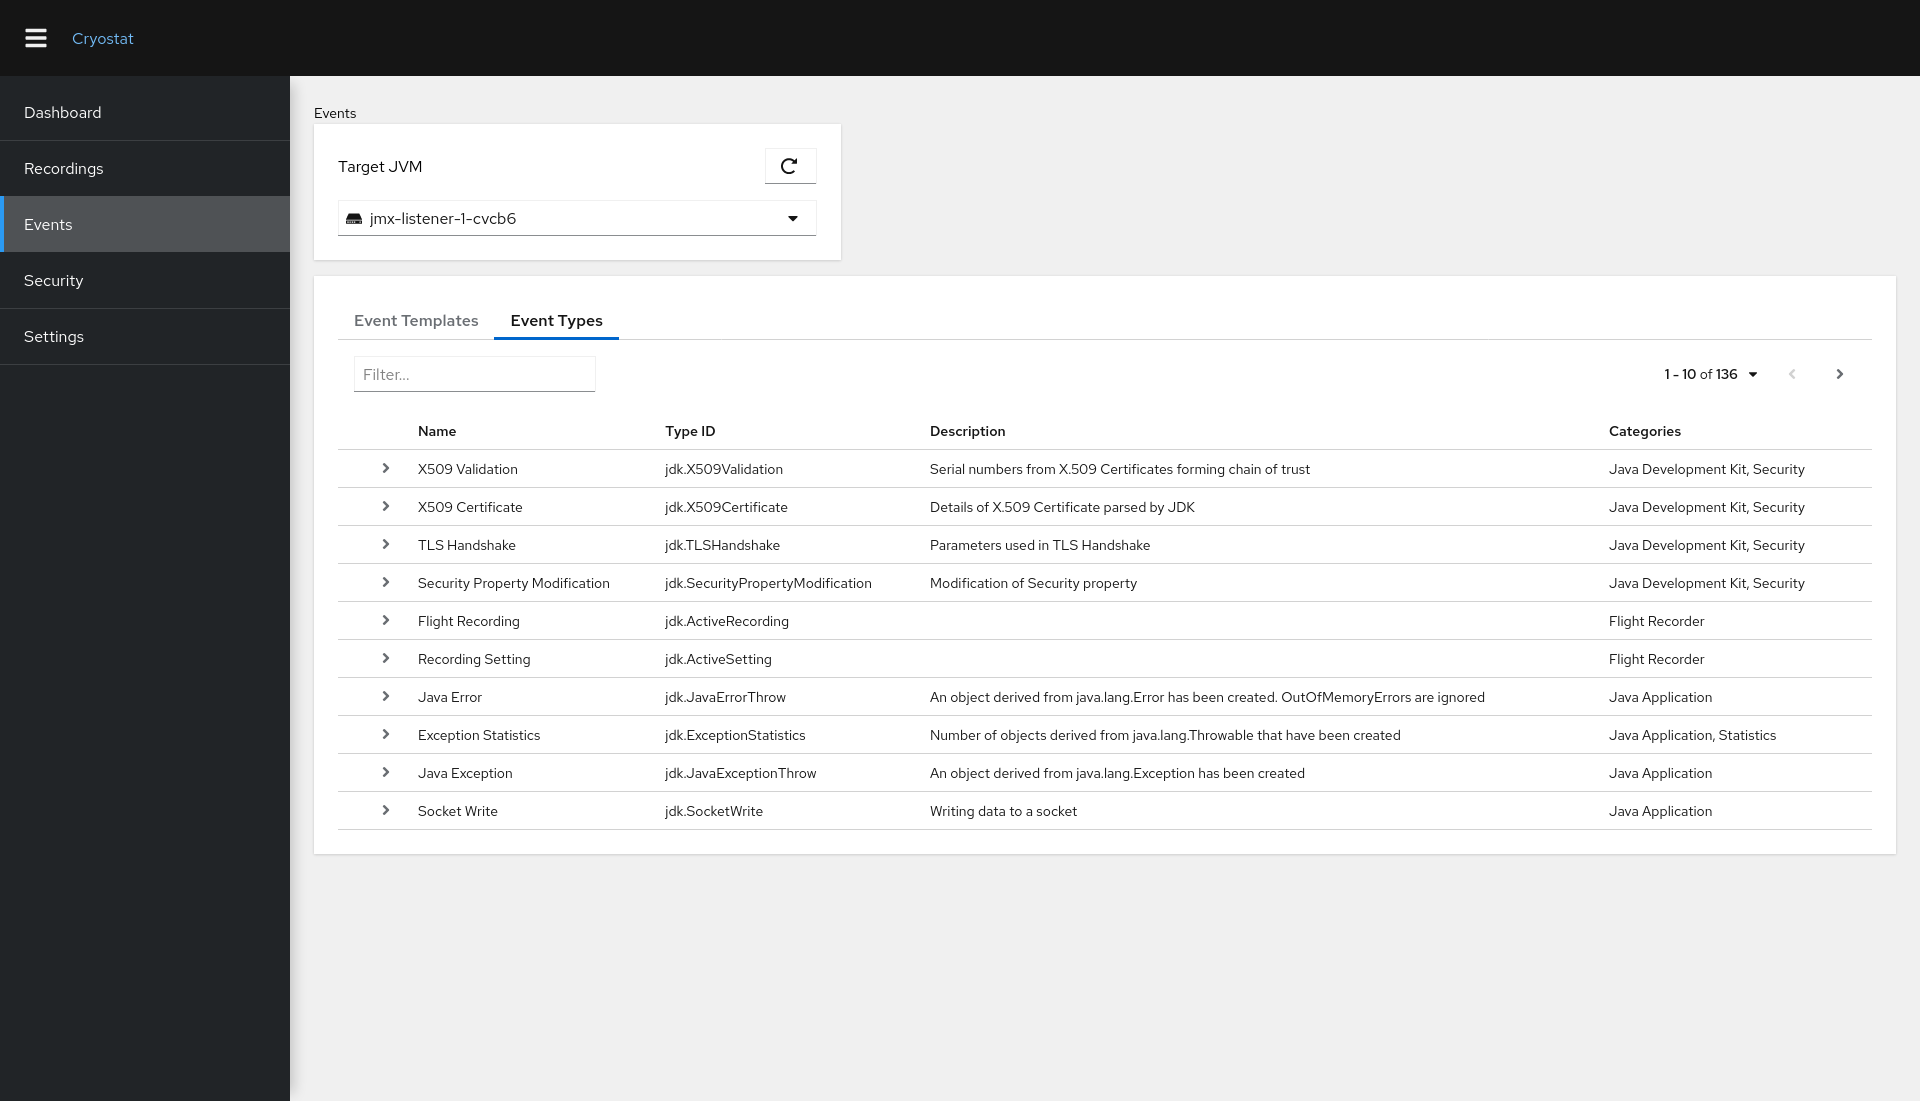
Cryostat supports JDK Flight Recorder event templates, which pre-set the event types and configuration properties to be supported. Using event templates simplifies the task of capturing meaningful data for your applications. Cryostat also includes a view that displays all of the event types registered with the JDK Flight Recorder framework for a target JVM. This view is useful when creating or modifying your own event templates.
The Event Templates view in Figure 6 displays pre-set event templates that you can download to your local machine to examine or modify. After you've modified a template, you can upload it for reuse. You can also create recordings from templates.
The Event Types view in Figure 7 displays all of the event types registered with the selected target JVM. You can use this view to search for events by category, keyword, or provider.
Editing templates
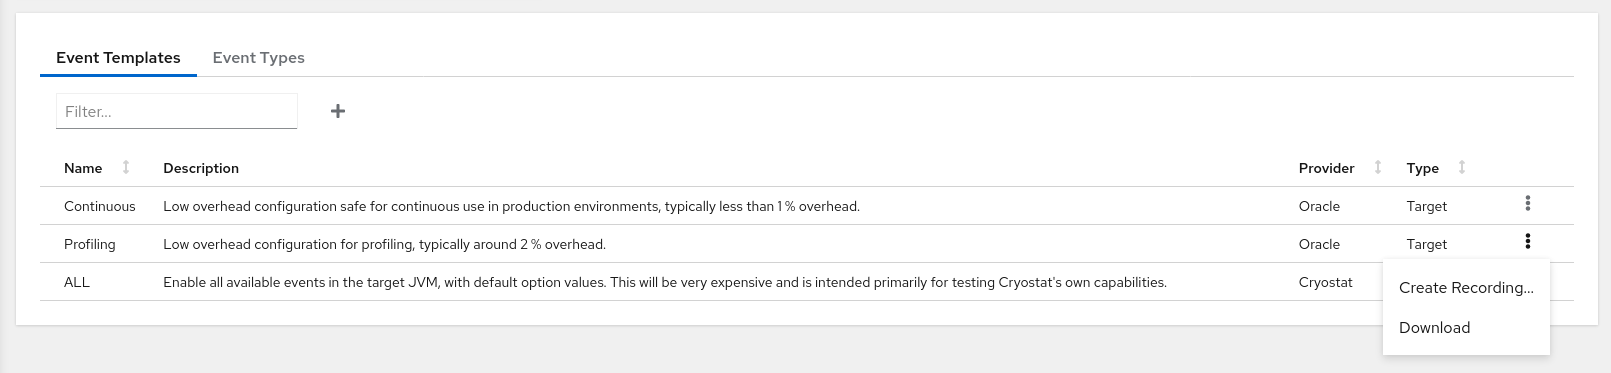
You can use Cryostat to download a template from a target JVM to your local machine, then open and inspect the template XML document with your favorite text editor. You can even import and edit the template using JDK Mission Control. Figure 8 shows the dialog to download an event template.
Custom templates
After you have created a custom template or modified an existing one, you can re-upload it to Cryostat, where it will be retained for future use. You will be able to apply the template whenever you create new recordings across your JVM applications.
You can open and edit event templates using any plain-text editor. Another option is to use JDK Mission Control's graphical template editor to import, edit, and export a template. Figure 9 shows an event template in a plain-text editor.

When you upload a new or modified template, Cryostat validates it, as shown in Figure 10.
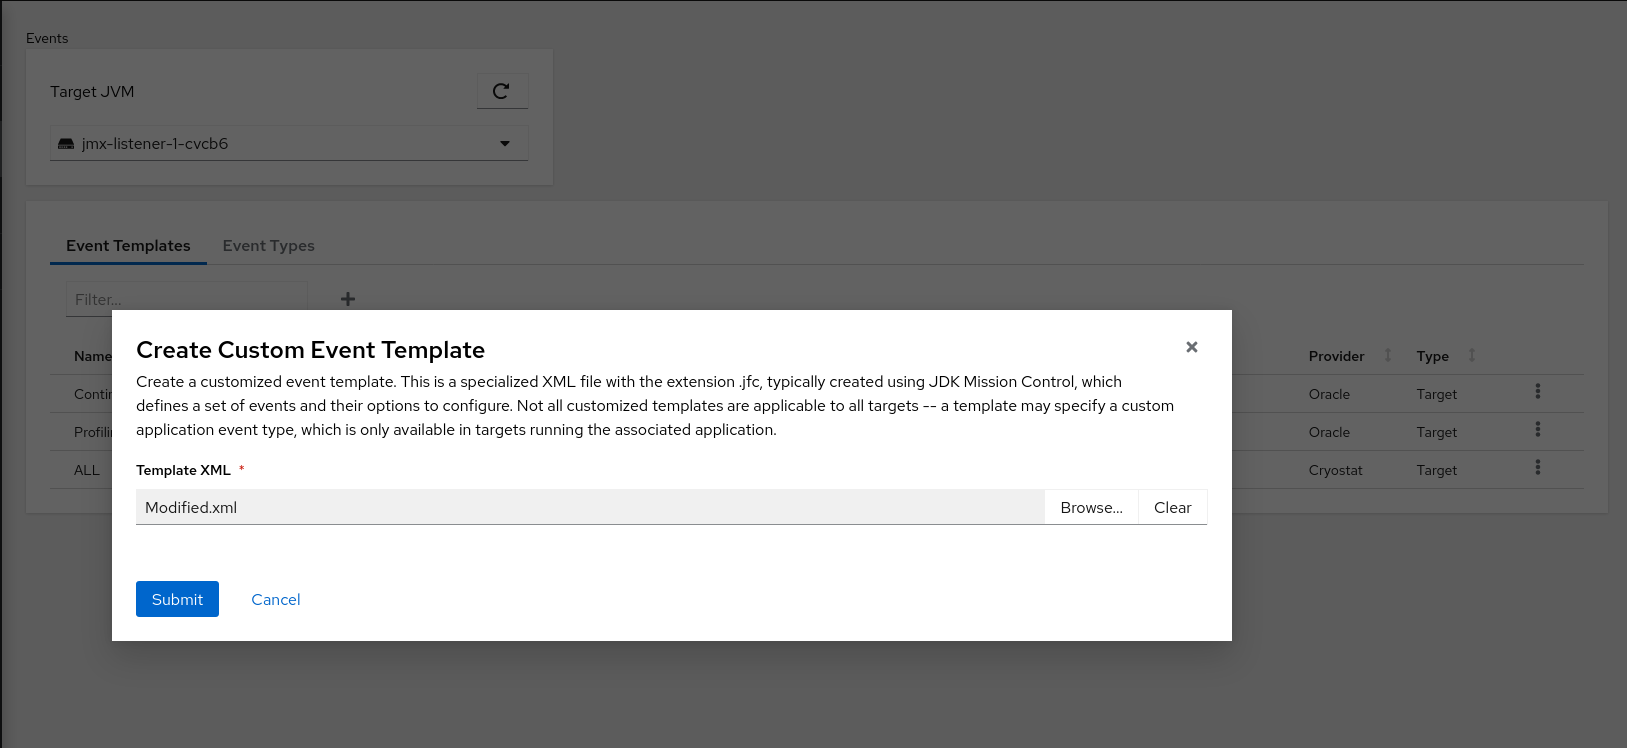
Figure 11 shows all of the available templates for a Cryostat instance.

All of these features also work with JDK Flight Recorder’s Custom Events API. You can create application-specific event types while developing your application, then create a custom event template including these events, and tailor your own continuous production recordings.
Recordings in Cryostat
Cryostat offers several ways to capture and preserve recordings, including custom recordings, snapshots, and archives.
Custom recordings
Figure 12 shows the configuration properties to be defined when you set up a new custom recording.

First is the name of the recording, which Cryostat uses to enforce uniqueness per target. You will also configure the duration before the recording is automatically stopped or if it should run continuously until it is manually stopped. You will need to configure the event specifier string or template for the events you want the recording to capture. Advanced properties include “to disk," “max size," and “max age." See the JDK Flight Recorder documentation to learn more about these properties.
Snapshots
Figure 13 shows the dialog to create a new snapshot recording. A snapshot is an overview of all of the information captured by other recordings.

If you have multiple custom recordings running in a target at once, you could use a snapshot to create a new recording file at that point in time. The snapshot contains the merged data from all of your other recordings. Snapshots can also be useful for preserving data from a single, continuous recording at a particular point in time.
Data flow
When you create a recording, you ask Cryostat to send instructions to your target JVM to start a flight recording. No data is transferred outside of your application at this point, only the name, state, and start time of your recordings, along with other basic metadata. The recording lives only in the memory of your target application, within its container. Figure 14 shows the recordings present in a target JVM.
Archives
Archiving streams a snapshot of a recording out of your application and into Cryostat. Cryostat immediately writes the snapshot to its local disk (or a persistent volume in OpenShift or Kubernetes) and drops it from memory. Even if your application is scaled down or otherwise goes away, you will still be able to access the recording for analysis. If you accidentally delete a .jfr file, you can re-upload it from your workstation’s local disk into the archives. This also works if you remove Cryostat from the cluster and re-install it later.
The archived recording list in Figure 15 displays all of the recordings saved to Cryostat's persistent storage, which is common across all target JVMs.

Automated analysis with Cryostat
Cryostat lets you run an automated analysis on your flight recordings within your cloud deployment without ever needing to transfer data to your local machine or outside of the cluster. You can use this feature to check your applications' health from a hotel with a slow connection or an airport using only your phone or tablet.
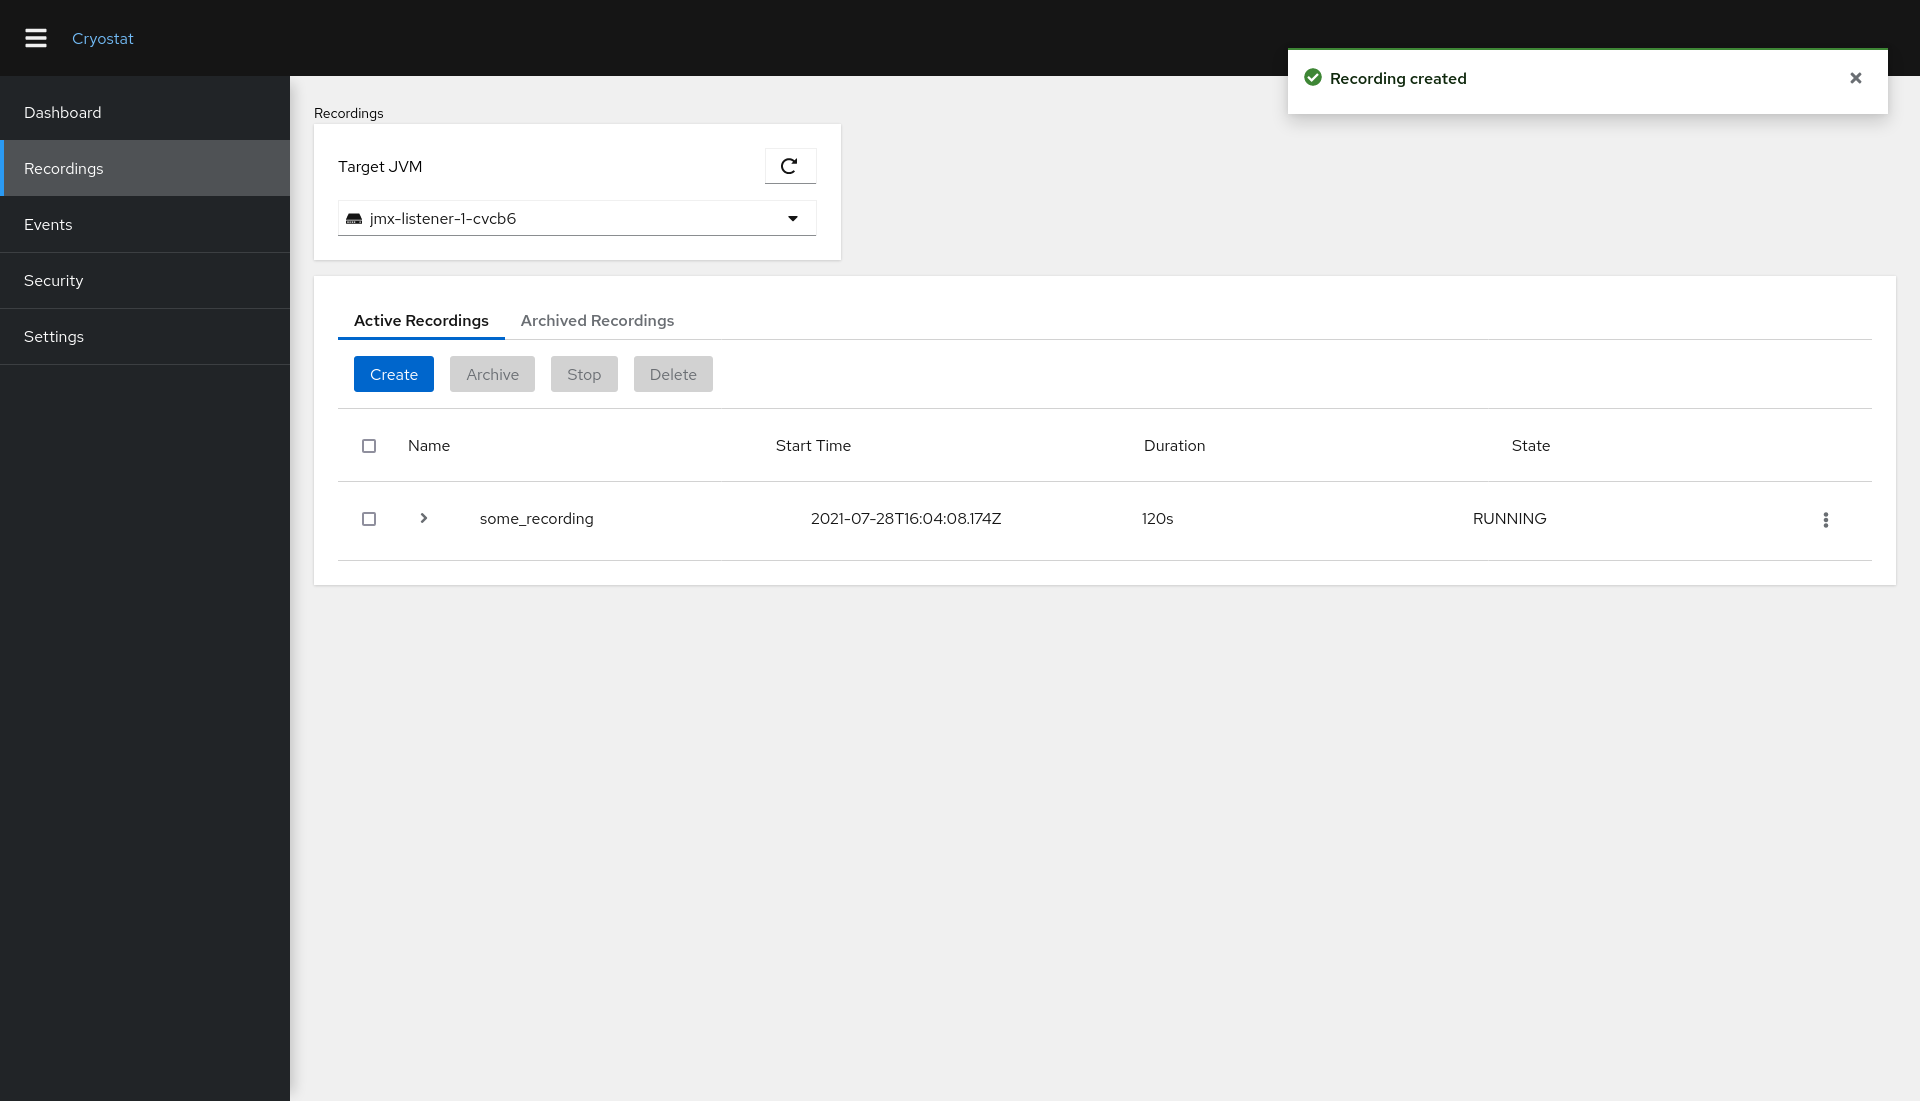
Expanding the list of active and archived recordings in Figure 16 reveals an automated analysis generated within the cluster.
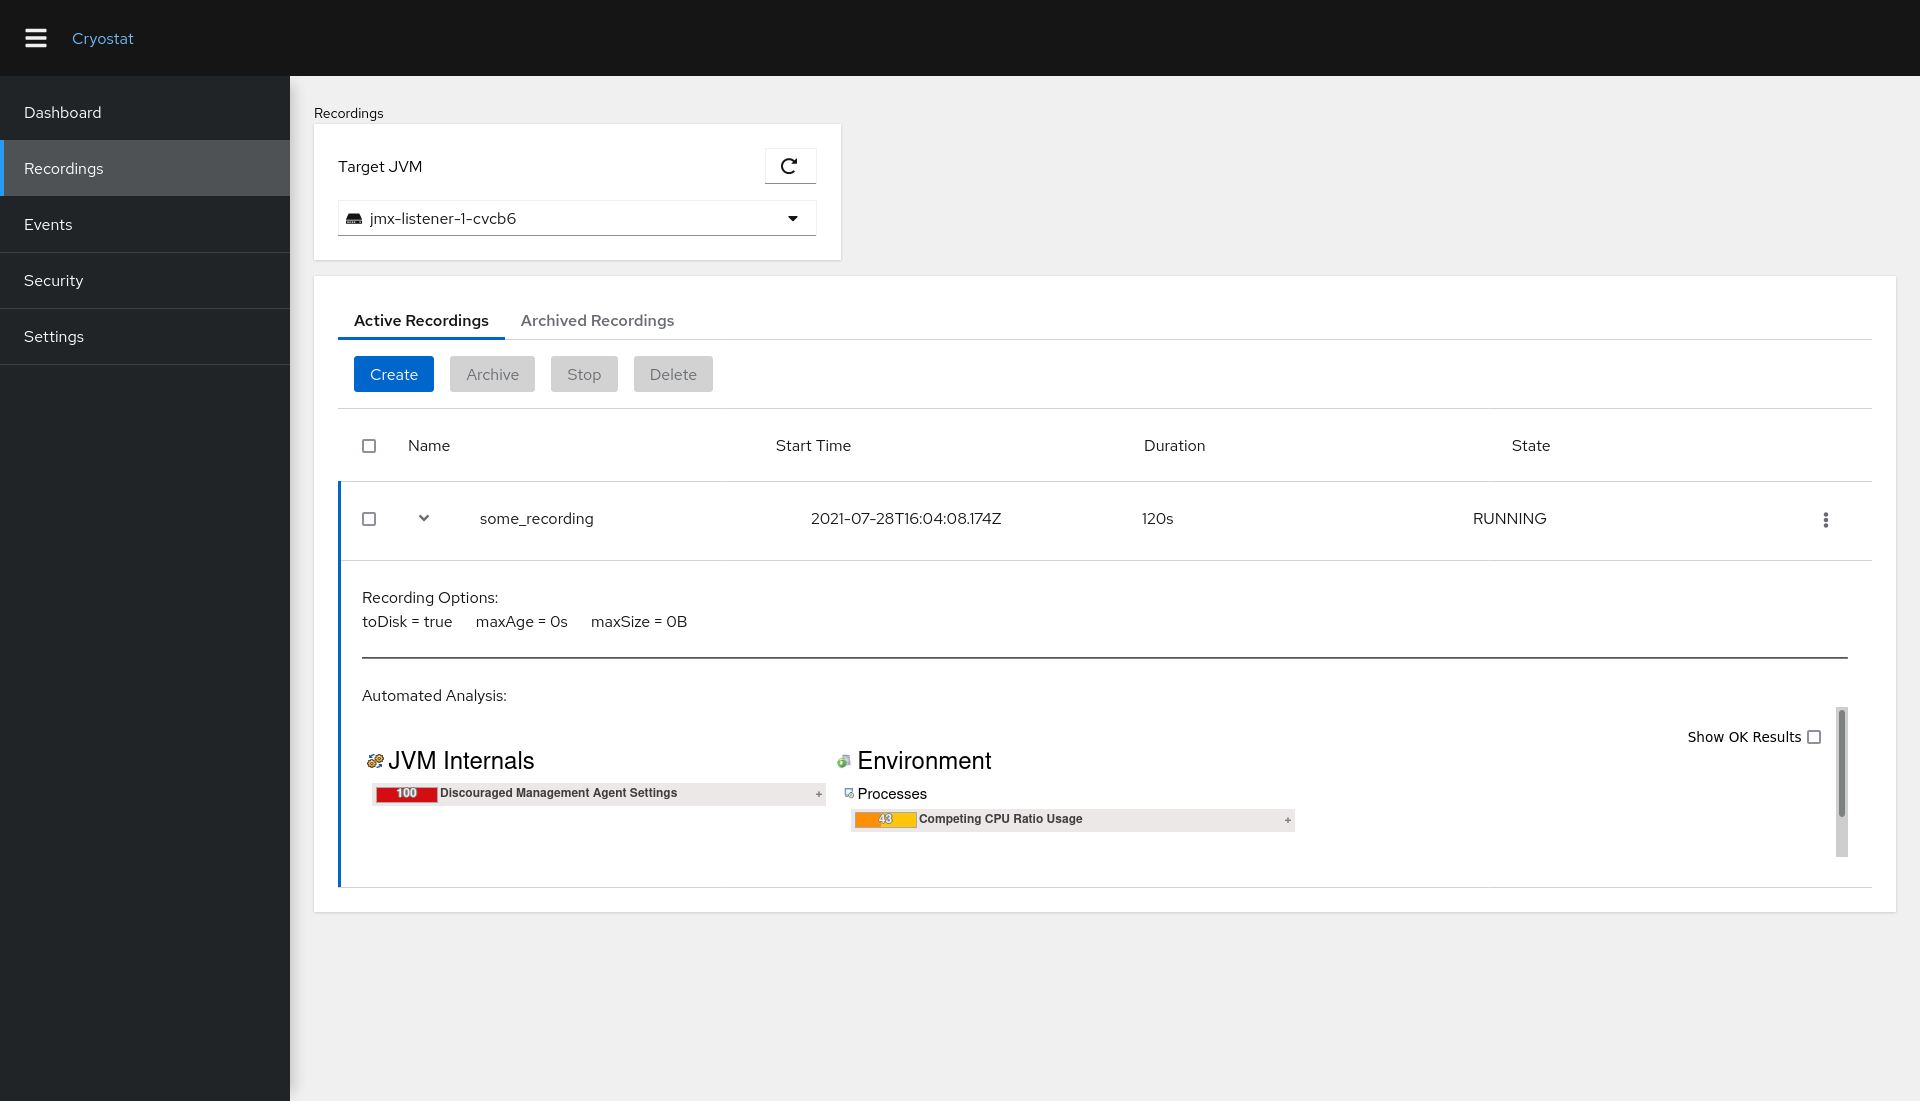
When you expand a recording, Cryostat uses its JDK Mission Control back end to generate an automated analysis report, alerting you to any apparent or probable issues with your application. You can also save reports in HTML format for future reference.
Using Grafana for analysis
If the automated analysis report doesn’t contain enough information for you, or if it points out a problem that you want to inspect more closely, you can send the recording to the jfr-datasource exporter within the Cryostat pod. From there, you can view the data using Grafana. Figure 17 shows the recording list item action menu, which you can use to send a recording to the Grafana dashboard.

Cryostat provides a pre-configured dashboard with time-series data, but you are encouraged to create your own dashboards with the metrics that matter to you. Note, again, that none of your data leaves the cluster. The jfr-datasource that provides the translation from a .jfr file to Grafana metrics is hidden within the Cryostat pod, and the Grafana dashboard instance is secured with generated credentials (stored in an OpenShift or Kubernetes secret) before being exposed to the outside world. It is easy to retrieve those generated credentials using the following commands:
$ oc get secret cryostat-grafana-basic -o json | jq -crM .data.GF_SECURITY_ADMIN_USER | base64 -d
$ oc get secret cryostat-grafana-basic -o json | jq -crM .data.GF_SECURITY_ADMIN_PASSWORD | base64 -d
Once you have the credentials, you can plug them into the Grafana dashboard's login page and start viewing your metrics, as shown in Figure 18.

Using JDK Mission Control for analysis
Finally, if you need even more detail, you can download a recording file from Cryostat to your local disk and open it with the full-featured offline JDK Mission Control desktop application. This is the only scenario where your recording actually leaves the cluster. Figure 19 shows a recorded file open in the JDK Mission Control desktop application.

The JDK Mission Control desktop application offers a wealth of features and capabilities, but I will leave that discussion for another article.
Secure authentication with Cryostat
JDK Flight Recorder captures a tremendous amount of data with no significant runtime overhead. Keeping the data secure and ensuring its integrity is vital. As shown in Figure 20, Cryostat does not require your application to open its JMX connections to the world—only to connections from inside your OpenShift namespace or your Docker or Podman network.
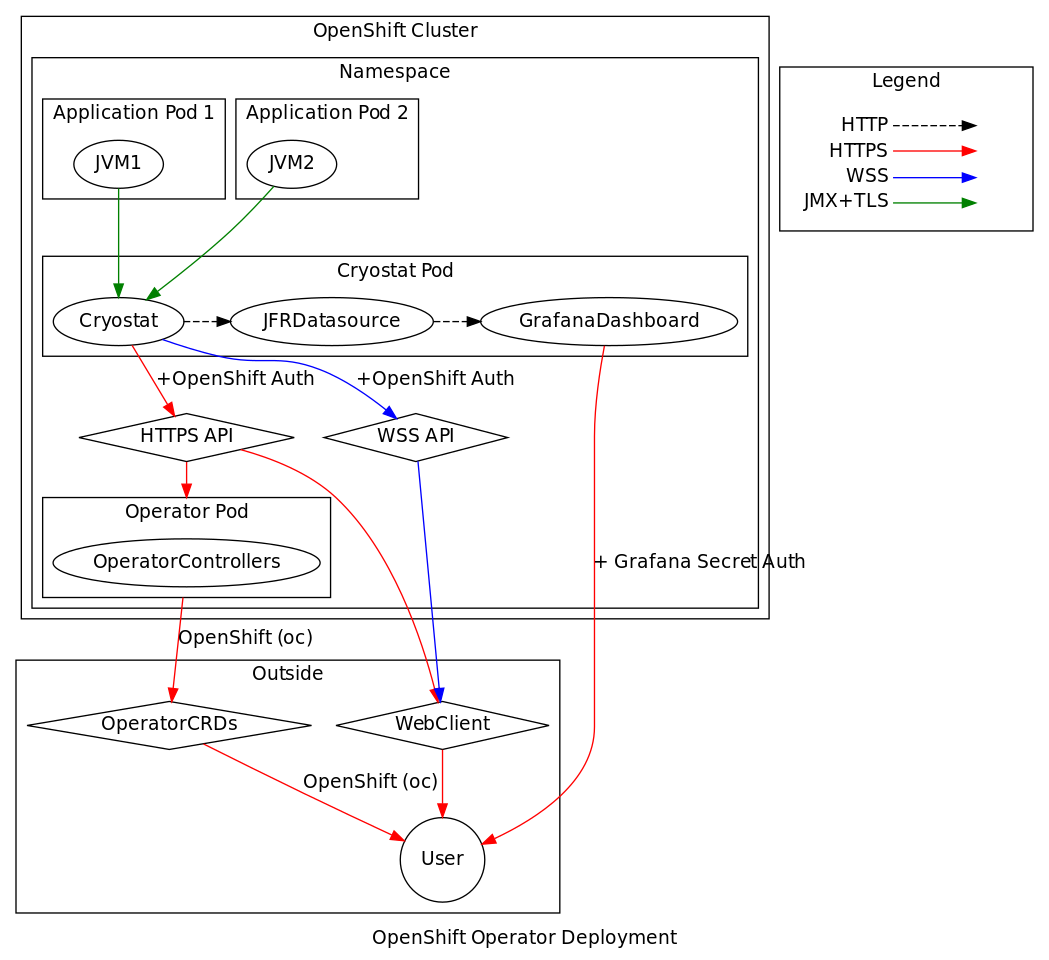
Once Cryostat has received a copy of your JDK Flight Recorder data—which it does only upon your instruction—that data is accessible only through secured API requests. The secured API requests support JMX authentication to connect to your application and another authentication layer to connect to Cryostat.
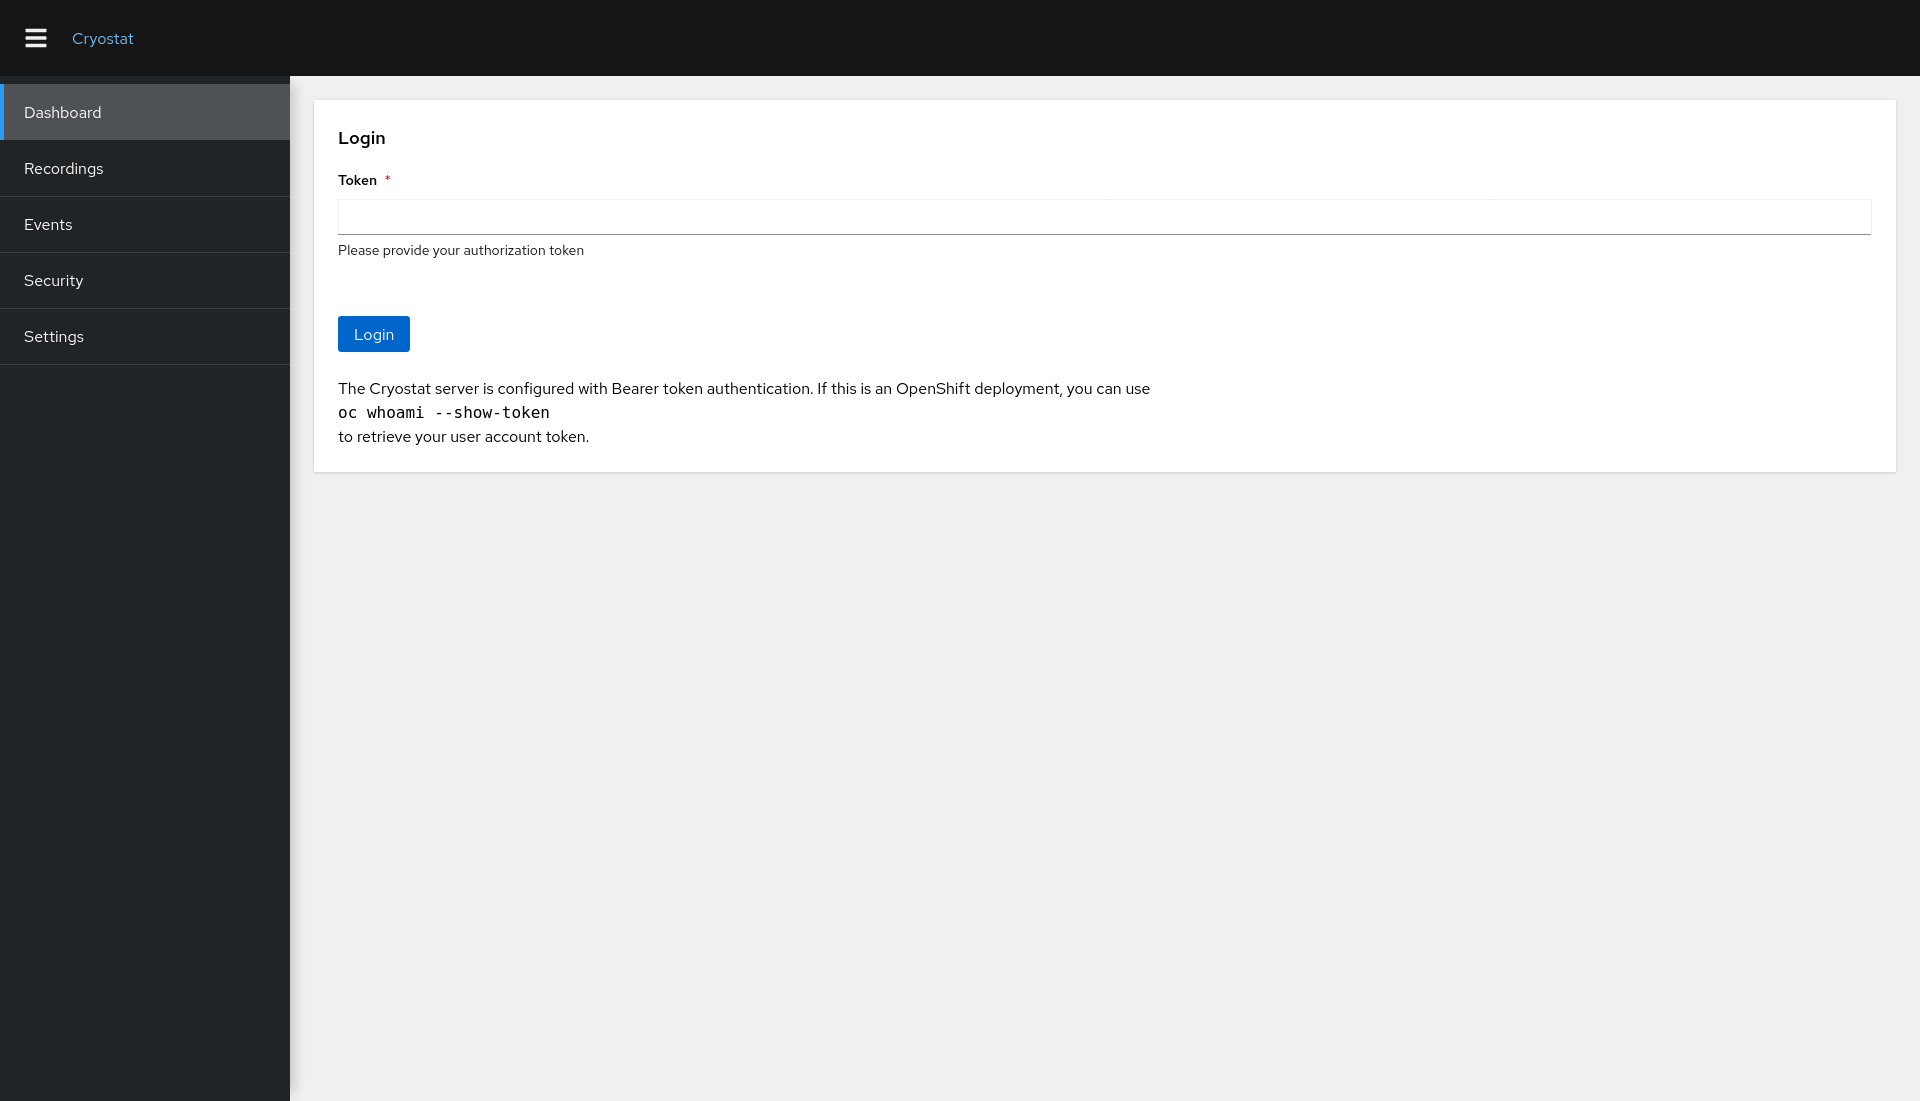
When running in OpenShift, all sensitive API requests require a user account token for authentication, as shown in Figure 21. Note that requests from the client to Cryostat over HTTP or WebSocket and requests from Cryostat to targets over JMX all support and enable the Secure Socket Layer or Transport Layer Security (SSL/TLS) protocol by default.
Future plans for Cryostat
Cryostat is still a young project, and the worlds of containers and monitoring are always expanding, so there is a lot on our horizon. In the future, we hope to make the following changes and improvements to Cryostat:
- Implement better and more flexible ways for Cryostat to identify, group, and label target applications. One example is the ability to examine OpenShift or Kubernetes labels and annotations.
- Add support for batched operations, used to manage recordings across a group of targets with a single request.
- Add a Trigger feature to allow recordings to be automatically started and stopped on a target or group of targets when a predefined event occurs. For example, when a new target appears, automatically start a recording with a predefined template.
- Embed Grafana views and other visualizations directly into the Cryostat web client.
- Provide integration or deep linking to the desktop JDK Mission Control application.
Visit the Cryostat repository for future updates.
Last updated: January 12, 2024