At the recent EclipseCon Europe in Ludwigsburg, Germany, we had a big dashboard in the IoT playground area showing graphs of the number of WiFi devices, the temperature, and air quality, all transmitted via LoRaWAN. We worked on this project during the community day and kept the setup throughout the conference, where we showed it and played with it even further. This article describes the architecture of the setup and gives pointers to replicate it.
The sensors
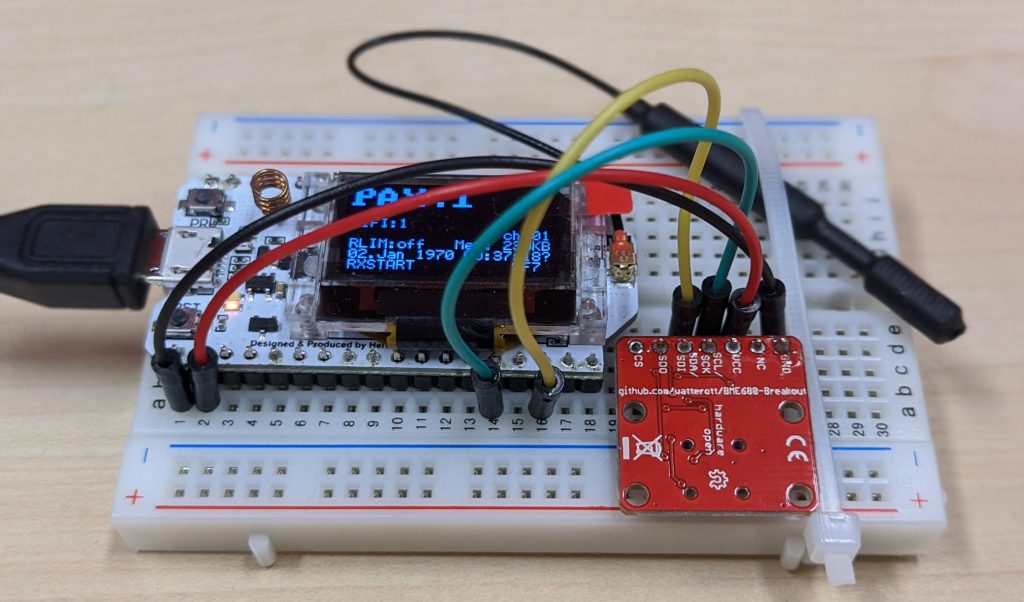
We chose this PAX Counter as our sensor device. Based on the ESP32 and LoRaWAN, it allows you to measure the number of unique WiFi clients in the area. The PAX counter, as the name suggests, only counts devices. It doesn't track them, and this functionality is exactly what we wanted. Also, you can add extra sensors, and the BME680 air quality sensor is supported right out of the box. While it is great to have open source firmware, having a ready-to-run experience is great as well. Fortunately, this PAX counter gave us both.
The cloud side
To have good LoRa coverage, we deployed two Things Network Indoor gateways. Those devices are rather cheap and easy to set up, and two of them were fine to cover the whole venue. Our initial goal was to provide the data visualization in a simple Grafana dashboard so that people could get a feeling of what we deployed.
Our back-end architecture made use of Eclipse Hono, the Qpid Dispatch Router, and Apache Kafka, and looked like this:
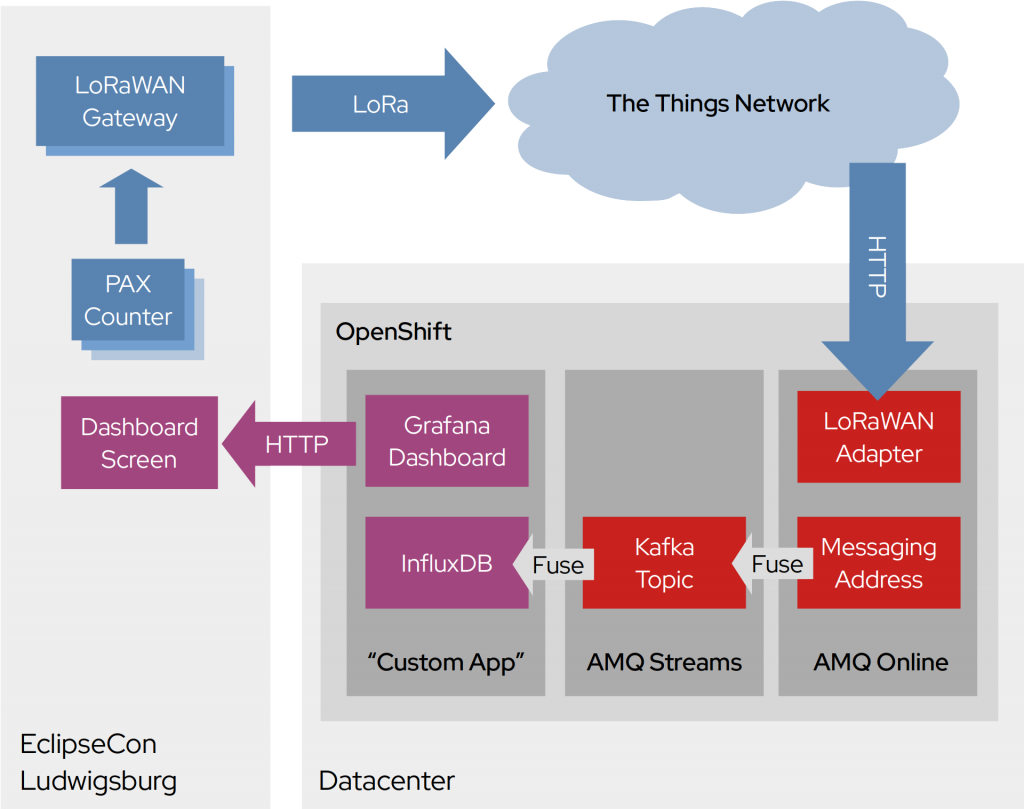
Forwarding telemetry data from The Things Network to a Grafana dashboard shouldn't require that many components. However, we had a little more in mind than just showing the data on a dashboard.
Ready for more than LoRaWAN
We teamed up with people from Eclipse MicroProfile, offering a connection to the data stream as well. For that, Apache Kafka seemed to be the right choice. Kafka can persist the data stream and allow you to connect to it at a later time, restarting to consume from the beginning while the already existing dashboard would continue to receive data without any change or interruption. We also could add as many users as we liked, consuming the data like all the others.
We didn't want to limit ourselves to this single sensor, and only to LoRaWAN or The Things Network. This is where Eclipse Hono comes into play. It has the ability to normalize different IoT protocols, like the LoRaWAN uplink, or MQTT and Sigfox into AMQP 1.0. Using this tool gave us the ability to plug in any other data provider without the rest of the data pipeline noticing.
Completing the setup
Of course, there is the issue of data formats. Both Eclipse Hono and Kafka are payload agnostic. Unfortunately, the sensors have their own data format, and InfluxDB has its custom API. Bringing both together isn't too difficult, but it's simpler when using Apache Camel. A few lines of XML or Java, and you have two running bridges, one forwarding raw IoT data from the EnMasse messaging address to the Kafka topic. The other one, for parsing the payload, and injects it into the InfluxDB.
Why did we decide to parse the payload in the second step? Kafka makes it so easy to store each and every message coming from the IoT layer. The sensors provided more data than we wanted to insert into the time series database. By handling things this way, we still had the raw values available in the Kafka cluster, ready for everyone else to consume them if necessary.
After deploying all of the sensors, it was awesome to see this visualization come to life:
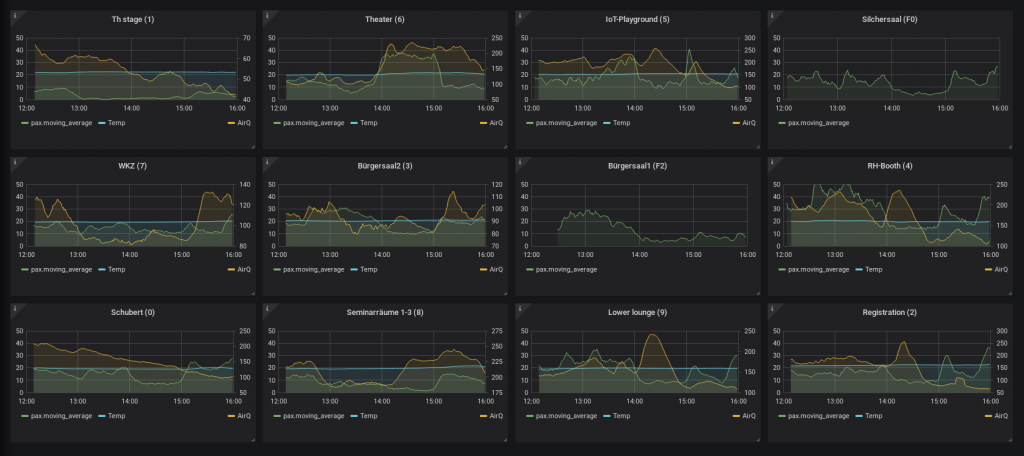
The big dashboard showed each sensor’s information with the number of WiFi devices, the current temperature, and an air quality index. By default, you could see the last three hours.
Playing with Microprofile
Of course, it would be great to do something more interesting with the data than just having a nice dashboard. That is what we started to play with during the community day by connecting a Quarkus application to the Kafka data stream and beginning to process it. Unfortunately, setting up proper TLS and authentication took longer than anticipated, so we ran out of time.
However, that doesn’t stop us from continuing. The repository in the next section will definitely see Quarkus examples related to IoT.
Try it for yourself
Deploying this solution was actually rather easy, and it should be easy enough for you to replicate. After all, we reused existing components like EnMasse and Strimzi to deploy Hono and Kafka. Of course, you can do the same with Red Hat AMQ Online and Red Hat AMQ Streams, as the LoRaWAN adapter is part of Red Hat AMQ Online 1.3's IoT tech preview.
You can find the deployment scripts in the GitHub repository ctron/ece2019-iot-playground.
Last updated: July 1, 2020