Microservices have become mainstream in the enterprise. This proliferation of microservices applications generates new problems, which requires a new approach to managing problems. A microservice is a small, independently deployable, and independently scalable software service that is designed to encapsulate a specific semantic function in the larger applicationl. This article explores several approaches to deploying tools to debug microservices applications on a Kubernetes platform like Red Hat OpenShift, including OpenTracing, Squash, Telepresence, and creating a Squash Operator in Red Hat Ansible Automation.
Expect challenges and changes on the microservices journey
A typical traditional monolithic application consists of a single process. It is easy to attach a debugger to this process to have a complete view of the runtime state of the application. In contrast, a microservices application can be composed of hundreds of processes. The main problem with debugging and finding the root cause in a distributed system is being able to recreate the state of the system when the error occurred so that you can obtain a holistic view. For this reason, troubleshooting is more difficult in a microservices environment,
Importantly, identifying the root cause of issues in microservices application can have a direct business impact. In fact, 40%2 to 90%3 of total software costs of are typically incurred after launch. It is important to knowing the right techniques and to deploying the right debugging tools in order to reduce time and money spent to correct software code.
Technical challenges with microservices applications
Microservices applications present unique challenges. Communication between services is asynchronous and not reliable, making errors difficult to reproduce. Moreover, services often interact with one another intermittently. The fine-grained approach to developing microservices lets developers choose the best language and framework for a specific job. As such, microservices can be written in different languages, and may be running across several different nodes. Together, these properties can make transactions difficult to step through.
“Debugging microservices applications is a difficult task. The state of the application is spread across multiple microservices, and it’s hard to get a holistic view of the state of the application. Currently, debugging of microservices is often assisted by OpenTracing, which helps in tracing of a transaction or workflow for postmortem analysis and more recently by service meshes like Istio, which monitor the network to identify latency problems in real-time. However, these tools do not allow you to monitor and interfere with the application during runtime" (solo.io).
OpenTracing
OpenTracing is an API specification for distributed tracing, and is the third hosted Cloud Native Computing Foundation (CNCF) project after Kubernetes and Prometheus. Jaeger is one of the most well-known OpenTracing implementations, and it is the distributed tracing solution used by Istio for Telemetry.
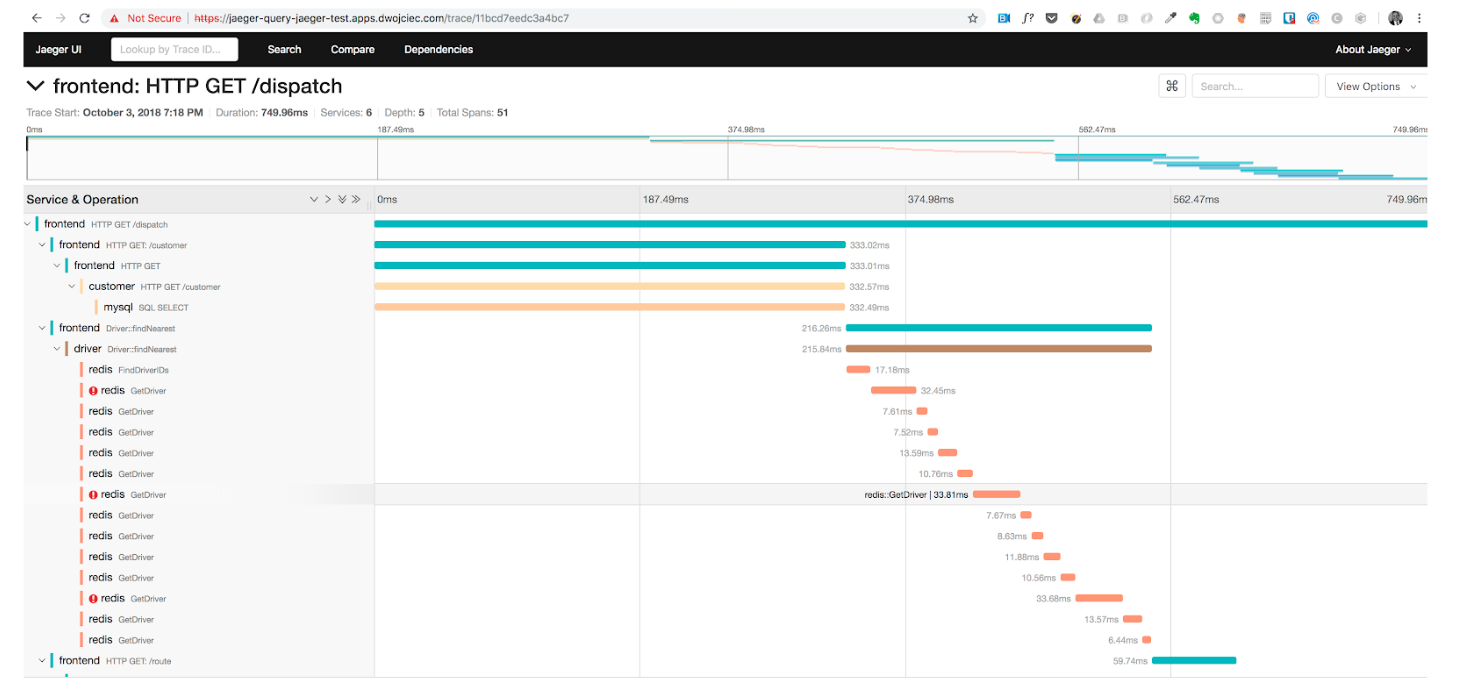
OpenTracing is often considered to be resource intensive, and logging the state of an application during runtime can result in a performance overhead. The BLOG Take OpenTracing for a HotROD Ride details the optimization of a HotRod ride app developed by Uber (see screenshot below). The article involves successive optimizations of a Go-based Ride-on-Demand demonstration service, all informed by tracing data.
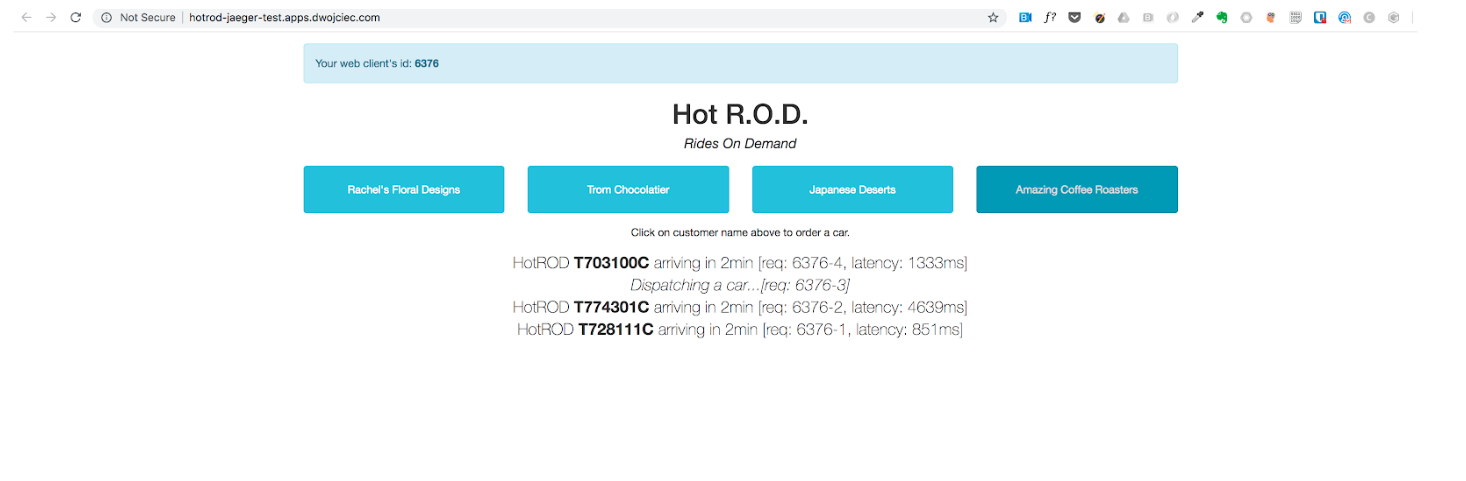 Picture 1 : HotRod Ride apps developed by Uber
Running OpenTracing in OpenShift
To run the HotRod example in OpenShift, execute the steps below:
$ oc new-project jaeger-demo
$ oc process -f https://raw.githubusercontent.com/jaegertracing/jaeger-openshift/master/all-in-one/jaeger-all-in-one-template.yml | oc create -f -
$ oc import-image jaegertracing/example-hotrod:1.6 --confirm
$ oc process -f https://raw.githubusercontent.com/dwojciec/debugging-microservices/master/jaeger/hotrod-app.yml | oc create -f -
Pros of this approach include:
- Logging - easy to output to any logging tool
- Context propagation - use baggage to carry request and user ID’s, etc.
- Critical path analysis - drill down into request latency
- System topology analysis - identify bottlenecks due to shared resource
- Metrics/alerting - measure based on tags, span time, log data
Cons of this approach include:
- OpenTracing does not provide run-time debugging
- OpenTracing requires wrapping and changing the code
- It is impossible to change variable values in runtime
- The process is expansive, requiring repeatedly modifying and testing the application
Squash
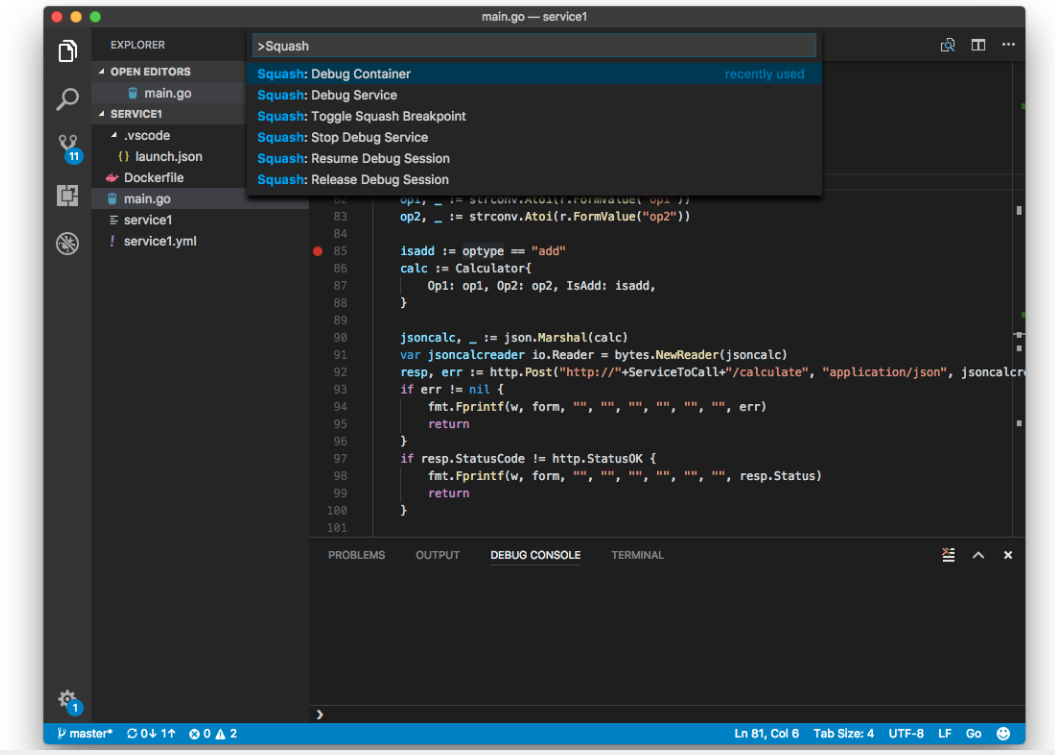
Squash allows runtime debugging on distributed applications and is integrated with integrated development environments (IDEs) such as Visual Studio code and IntelliJ. Squash is deployed to the cluster as a server and a DaemonSet, with your IDE acting as the Squash UI. Once the applications’ pods have been retrieved, use your IDE to attach to one of the running pods where you can select the service on which to start your debug session.
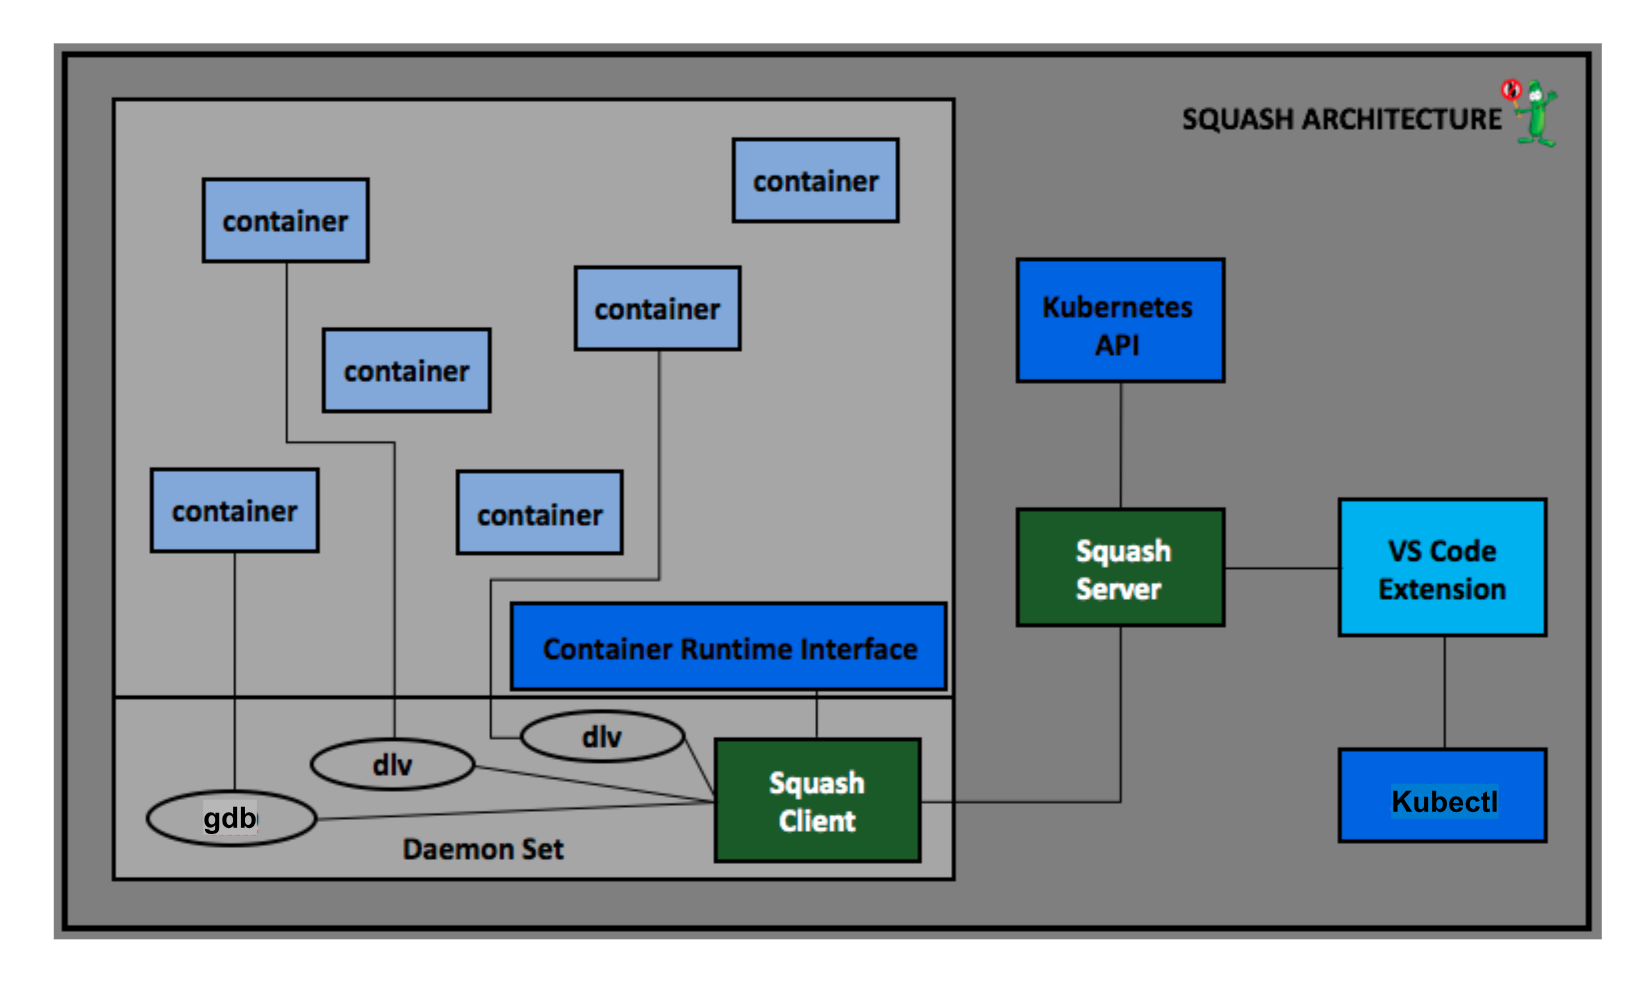
More information regarding Squash solution architecture is available.
With Squash, you can:
• Perform live debugging across multiple microservices
• Debug a container in a pod
• Debug a service
• Set breakpoints
• Step through the code
• View and modify values of variables
Running Squash in Openshift
Prerequisites : Use Openshift version 3.9 as higher versions are not yet tested. For versions higher than 3.9 you have to change the version of the squash image (from v0.2.1 to v0.3.1).
Squash-server and squash-client images are available.
To deploy a Squash application in OpenShift, follow the steps below:
$ oc new-project squash
$ oc process -f https://raw.githubusercontent.com/dwojciec/debugging-microservices/master/squash/squash-template.yaml -l name=squash | oc create -f -
$ oc adm policy add-scc-to-user privileged -z squash-client
$ oc get route
The Squash command-line interface (CLI) can be installed locally here. Additional information on the Squash CLI is available.
$ export SQUASH_SERVER_URL=<route exposed>/api/v2
$ squash list a
State |ID |Debugger |Image |Debugger Address
Install a Squash plugin for the appropriate IDE (Visual Studio code and Intellij) and setup the IDE.
Deploy a sample application to use Squash.
$ oc new-project demo-squash
$ oc process -f https://raw.githubusercontent.com/dwojciec/debugging-microservices/master/squash/demo-squash.yaml | oc create -f -
Note: I added an annotation on the route definition haproxy.router.openshift.io/timeout: 5m to debug the application.
Clone the application locally on your system.
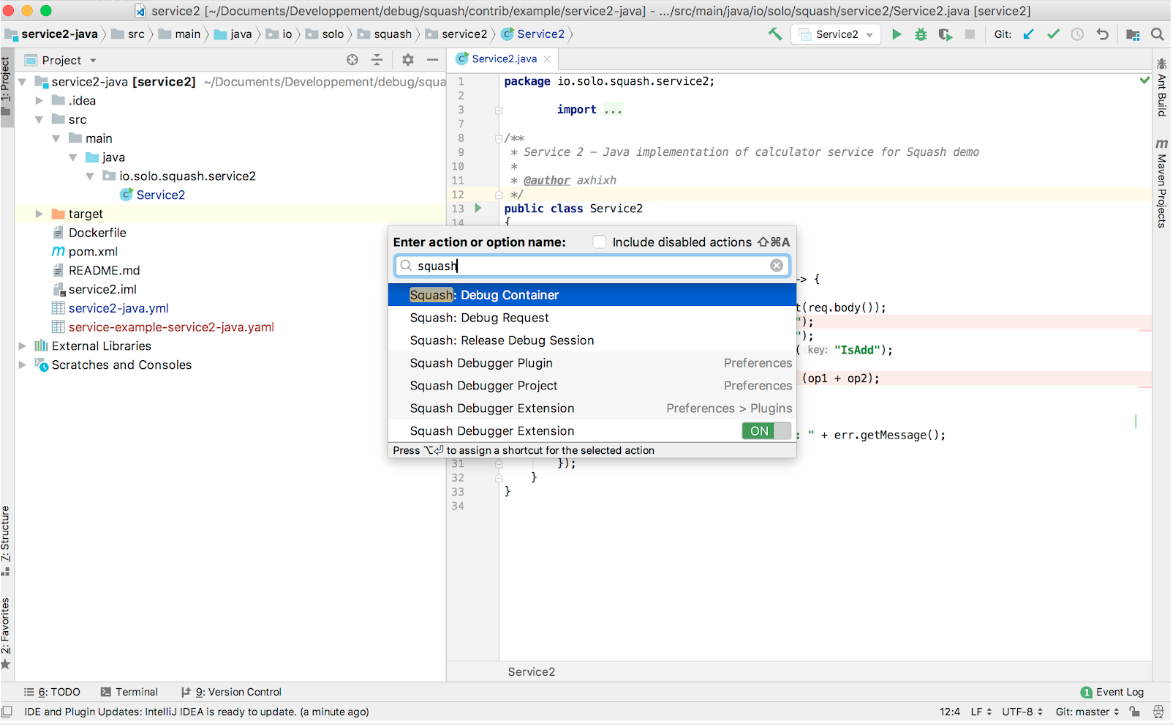
$ git clone https://github.com/solo-io/squash.git
$ cd squash/contrib/example
$ code ~/squash/contrib/example/service1/
$ idea ~/squash/contrib/example/service2-javaRestart pod of the demo application to release any debug attachment
$ oc delete pod --all --grace-period=0 -n demo-squash
Telepresence
Telepresence offers another alternative to debuging code deployed on a Kubernetes cluster. Telepresence is currently a sandbox project at the CNCF. Using Telepresence on Openshift is presented here and in a blog post titled “Telepresence for local developement”.
References to go further:
- Debugging and Troubleshooting Microservices in Kubernetes with Ray Tsang (Google)
- Debugging microservices - Squash vs. Telepresence
- Developing on Kubernetes
- Development and Debugging with Kubernetes
- Rookout: breakpoints for Kubernetes ?
Debugging techniques:
- Debugging Microservices: How Google SREs Resolve Outages
- Debugging Microservices: Lessons from Google, Facebook, Lyft
- Troubleshooting Java applications on OpenShift
- Debug a Go Application in Kubernetes from IDE (The Hard Way).
Creating a Squash Ansible Operator
Based on the User Guide which walks through an example of building a simple memcached-Operator powered by Ansible tools and librairies provided by the Operator SDK, I decided to build my Squash Operator.
Source code is available.
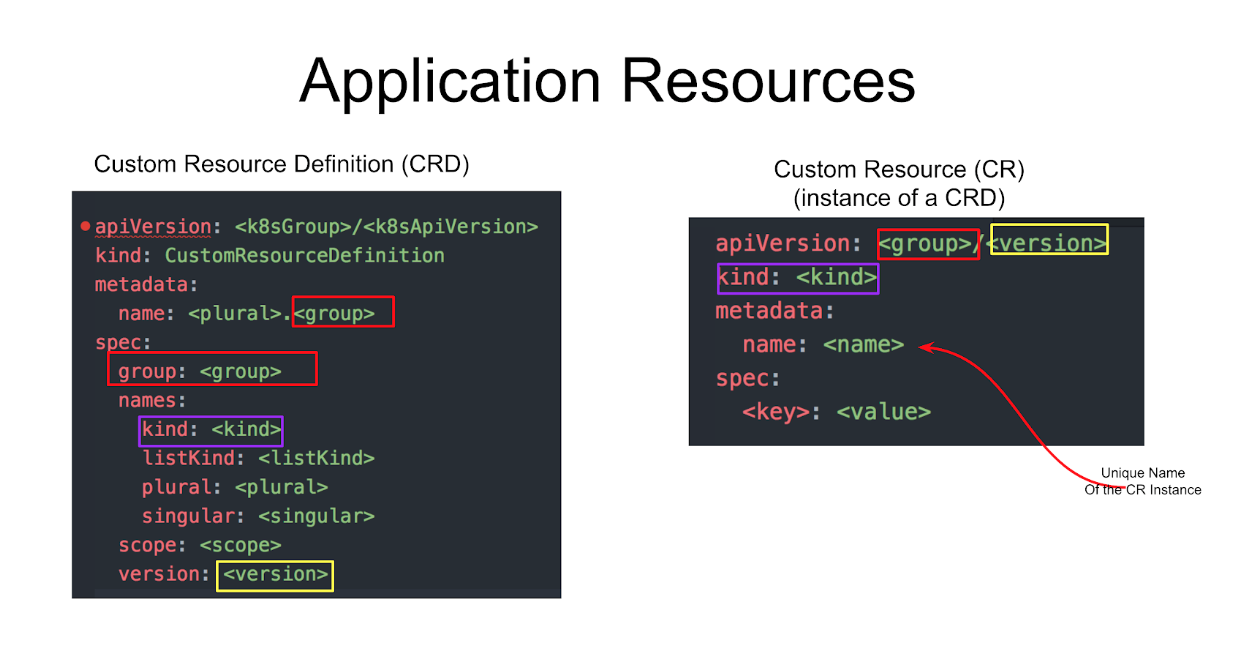
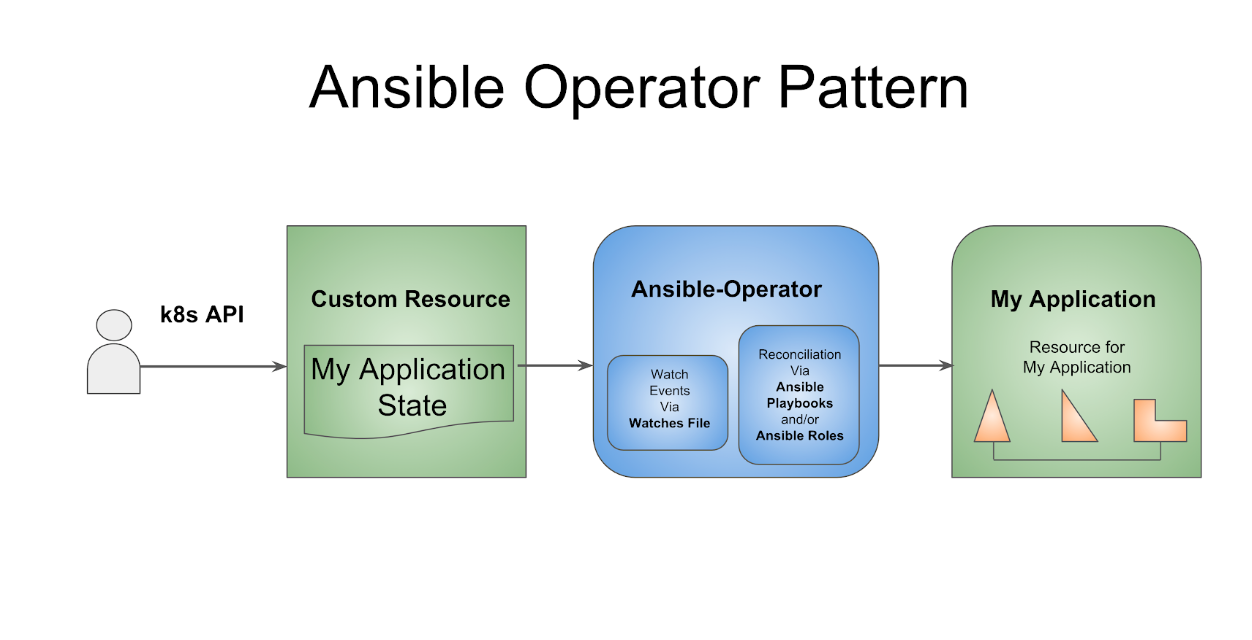
An Operator is a Kubernetes controller that deploys and manages an application’s resources and services in Kubernetes. In Kubernetes each of your application’s resources can be defined by a custom resource definition (CRD). CRDs uniquely identify your applications custom resources by its Group, Version, and Kind in a Kubernetes cluster. Once the CRDs have been created, you would then create an instance of the custom resource, or CR, with a unique name.
Create a new operator
$ $GOPATH/bin/operator-sdk --version
operator-sdk version 0.0.6+git
$ mkdir -p -p $GOPATH/src/github.com/squash-operator/
$ cd $GOPATH/src/github.com/squash-operator/
The Operator SDK provides an option to create an Ansible Operator. An Ansible Operator leverages the full power of Ansible and it does not require the knowledge or the experience of any other programming language like GO or Java. You simply write some Ansible code and edit a few YAML files to get your Operator up and running.
$ $GOPATH/bin/operator-sdk new squash-operator --api-version=app.example.com/v1alpha1 --kind=Squash --type=ansible
operator-sdk version 0.0.6+git
Create squash-operator/tmp/init/galaxy-init.sh
Create squash-operator/tmp/build/Dockerfile
Create squash-operator/tmp/build/test-framework/Dockerfile
Create squash-operator/tmp/build/go-test.sh
Rendering Ansible Galaxy role [squash-operator/roles/Squash]...
Cleaning up squash-operator/tmp/init
Create squash-operator/watches.yaml
Create squash-operator/deploy/rbac.yaml
Create squash-operator/deploy/crd.yaml
Create squash-operator/deploy/cr.yaml
Create squash-operator/deploy/operator.yaml
Run git init ...
Initialized empty Git repository in /Users/dwojciec/go/src/github.com/squash-operator/squash-operator/.git
Run git init done

$ cd squash-operator
$ tree
.
├── deploy
│   ├── cr.yaml
│   ├── crd.yaml
│   ├── operator.yaml
│   └── rbac.yaml
├── roles
│   └── Squash
│       ├── README.md
│       ├── defaults
│       │ └── main.yml
│       ├── files
│       ├── handlers
│       │ └── main.yml
│       ├── meta
│       │ └── main.yml
│       ├── tasks
│       │ └── main.yml
│       ├── templates
│       ├── tests
│       │ ├── inventory
│       │ └── test.yml
│       └── vars
│           └── main.yml
├── tmp
│   └── build
│       ├── Dockerfile
│       ├── go-test.sh
│       └── test-framework
│           └── Dockerfile
└── watches.yaml
14 directories, 16 files
Once all the code is generated by the Operator SDK. Go to the deploy directory to check the content of all files.
$ pwd

/Users/dwojciec/go/src/github.com/squash-operator/squash-operator/deploy
$ tree
.
├── cr.yaml
├── crd.yaml
├── operator.yaml
└── rbac.yaml

0 directories, 4 files
I updated rbac.yaml with this code. Check the content of the rbac.yaml file because by default the namespace used is the default one for ClusterRoleBinding and you may want to use a different project to deploy your application. In my case I deployed my Operator in a project I created named operator-squash . I added and created a sa.yaml file to define ServiceAccount for my application squash-operator.
Building the Squash Ansible Role
The first thing to do is to modify the generated Ansible role under roles/Squash. This Ansible Role controls the logic that is executed when a resource is modified.
I updated the empty file roles/Squash/tasks/main.yaml with the following:
---
# tasks file for squash-server
- name: start squash-server
 k8s:
   definition:
     kind: Deployment
     apiVersion: apps/v1
     metadata:
       name: squash-server
       namespace: '{{ meta.namespace }}'
     spec:
       selector:
         matchLabels:
           app: squash-server
       template:
         metadata:
           labels:
             app: squash-server
         spec:
           containers:
           - name: squash-server
             image: soloio/squash-server:v0.2.1

- name: start squash-client
 k8s:
   state: present
   definition: "{{ lookup('template', '/opt/ansible/k8s/squash-client.yml') | from_yaml  }}"

- name: create squash-server service
 k8s:
   state: present
   definition: "{{ lookup('template', '/opt/ansible/k8s/squash-server-svc.yml') | from_yaml  }}"
This Ansible task is creating a Kubernetes deployment using the k8s Ansible module which allows you to easily interact with the kubernetes resources idempotently.
Update of the Dockerfile (tmp/build/Dockerfile)
Inside the roles/Squash/tasks/main.yaml file I’m using multiples external files such as '/opt/ansible/k8s/squash-server-svc.yml'. To consume these files I updated the Dockerfile to add them.
I updated squash-operator/tmp/build/Dockerfile from:
FROM quay.io/water-hole/ansible-operator
COPY roles/ ${HOME}/roles/
COPY watches.yaml ${HOME}/watches.yaml
To:
FROM quay.io/water-hole/ansible-operator
COPY k8s/ ${HOME}/k8s/
COPY roles/ ${HOME}/roles/
COPY playbook.yaml ${HOME}/playbook.yaml
COPY watches.yaml ${HOME}/watches.yaml
Update the the watches.yaml file
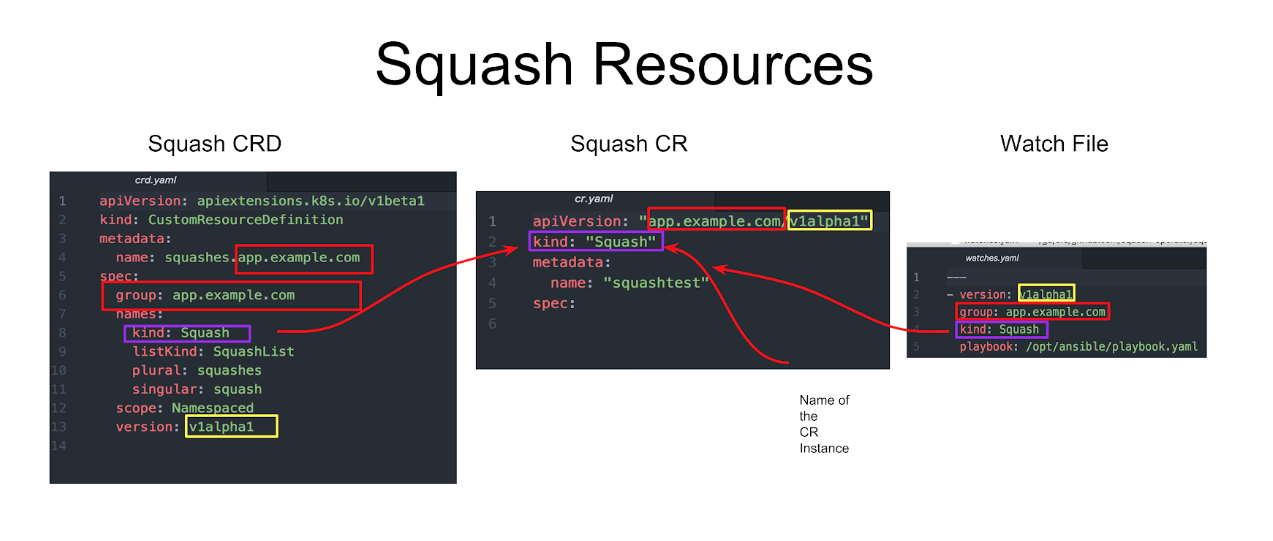
By default the Operator SDK generated watches.yaml file watches Squash resource events and executes Ansible Role Squash.
 $ cat watches.yaml
---
- version: v1alpha1
  group: app.example.com
  kind: Squash
  role: /opt/ansible/roles/Squash
I decided to use the Playbook option by specifying a playbook.yaml file inside watch.yaml which will configure the operator to use this specified path when launching ansible-runner with the Ansible Playbook.
 ---
- version: v1alpha1
  group: app.example.com
  kind: Squash
  playbook: /opt/ansible/playbook.yaml
  finalizer:
    name: finalizer.app.example.com
    vars:
      sentinel: finalizer_running
Build and run the Operator
Before running the Squash Operator, Kubernetes needs to know about the new CRD the Operator will be watching.
Deploy the CRD as follows:
 $ oc new-project operator-squash
 $ kubectl create -f deploy/crd.yaml
Then build the squash-operator image and push it to a registry.
 $ $GOPATH/bin/operator-sdk build quay.io/dwojciec/squash-operator:v0.0.1
 $ docker push quay.io/dwojciec/squash-operator:v0.0.1
Kubernetes deployment manifests are generated in deploy/operator.yaml. The deployment image in this file needs to be modified from the placeholder REPLACE_IMAGE to the previous built image.
Edit deploy/operator.yaml file and change :
spec:
      containers:
        - name: squash-operator
          image: REPLACE_IMAGE
          ports:
To
spec:
      containers:
        - name: squash-operator
          image: quay.io/dwojciec/squash-operator:v0.0.1
          ports:
Finally, deploy the squash-operator.
$ kubectl create -f deploy/rbac.yaml
$ kubectl create -f deploy/operator.yaml
$ kubectl create -f deploy/sa.yaml
Conclusion
Thanks for reading this article. I hope you found interesting information. And if you want to deep dive I encourage you to go further and I'm sharing some links below.
Consult these references to go further:
References
- Global Microservices Trends: a survey of Development Professionals April 2018
- Facts and Fallacies of Software Engineering, Glass, R , Addison-Wesley Professional, 2002, p 115
- Which Factors Affect Software Projects Maintenance Cost More? Dehaghani, S.M.H., Hajrahimi, N., Informatica Medica, 2013
Last updated: March 18, 2024