Picture this scenario. It is 2 AM. Checkout is down. Customers cannot pay.
You jump between Grafana, search application logs, and scroll through last month's incident reports, looking for the deployment that caused the same symptoms. Three systems. Three sets of credentials. Three different types of sensitive data.
Now imagine an AI agent doing this for you. One agent with access to your metrics, your logs, and your runbooks. Fast, thorough, parallel.
There is one problem: that agent now has the keys to everything. If it gets prompt-injected through a malicious log entry, the attacker inherits every credential and every network path the agent holds. Your helpful assistant just became a single point of compromise for your entire monitoring stack.
Here is how you fix that, step by step.
Why isolation matters for agents
Back to the checkout outage. A single unsandboxed agent investigating it needs access to Prometheus (metrics), Loki (logs), and Confluence (runbooks). It holds credentials for all three and runs with a network policy that allows all three.
- Unlimited blast radius. A crafted log entry in Loki triggers a prompt injection. The attacker now has the agent's Prometheus credentials, its Confluence token, and its network path to the deployment API. One compromised data source, three exposed systems.
- No data boundary. The agent reads customer request payloads from the logs (including personally identifiable information, or PII, in headers and bodies), then queries aggregate latency metrics, and then searches past incident reports. All of that context sits in one process memory.
- Credential sprawl. The agent holds credentials for three systems with different sensitivity levels. You would never give a log searcher your deployment keys, but a single agent forces that tradeoff.
Sandboxing solves this. In a previous post, we showed how to confine an agent's tool execution inside an OpenShell sandbox on your cluster: kernel-enforced file system isolation (Landlock), syscall filtering (seccomp), per-binary network policy, and a deny-all default. That pattern sandboxes execution. One brain in the cloud, one sandbox on your cluster.
Note
OpenShell is a planned feature for upcoming Red Hat AI releases, and its final availability remains subject to change.
When a single sandbox is not enough
A single sandbox confines code execution. But the agent itself, the part that decides what to read, what to query, and what to write, still runs as one process with one set of permissions. For many workloads, that is enough. For incident investigation, it is not.
The checkout agent needs to query Prometheus, search Loki, and read Confluence in the same session. A single sandbox cannot restrict access to only one of those systems because the same process needs all three. That creates three problems:
- Mixed sensitivity levels. Logs contain customer request payloads with PII (credit card tokens, session IDs). Metrics are aggregate numbers. Runbooks are internal documentation. All three have different sensitivity, but the sandbox treats them identically.
- Credential mixing. The sandbox holds credentials for Prometheus, Loki, and Confluence simultaneously. If the sandbox is compromised through any one of them, all three are exposed.
- Cross-contamination. Context from one data source leaks into queries against another. A prompt injection planted in the logs can use the agent's Prometheus credentials to craft metric queries, or use its Confluence token to search internal documentation.
The fix is not more sandboxes around a single agent. A single agent needs all three systems in one session, so any sandbox around it must allow all three. The fix is to split the work into multiple agents, each scoped to one system, each in its own sandbox with its own policy. The metrics agent only needs Prometheus. The log agent only needs Loki. The runbook agent only needs file access. Now each sandbox can enforce least privilege because each agent only handles one specific task.
Why multiple agents without sandboxes do not help
Splitting work across specialized agents improves quality. Razorpay reduced incident investigation from 20-40 minutes to 90 seconds by running specialized agents against six different monitoring systems in parallel. Datadog runs over 100 agents in production, each scoped to a single domain.
You could split the checkout investigation into three agents: a metrics agent for Prometheus, a log agent for Loki, and a runbook agent for Confluence. Each agent handles one system. But without per-agent isolation, specialization is a logical boundary, not a security one.
- Shared runtime. All three agents run in the same container. The log agent reads customer payloads into memory. The metrics agent, running in the same process, can access that memory.
- Shared network. All three agents inherit one network policy. The runbook agent, which only needs read-only file access, can reach the Prometheus API because the metrics agent needs it.
- No teardown. After the metrics agent finishes, its Prometheus credentials and cached data remain in the sandbox. The next agent inherits that state.
Give each agent its own sandbox with its own policy, its own file system namespace, and its own network scope. The metrics agent can reach Prometheus and vLLM, nothing else. The log agent can reach Loki and vLLM, nothing else. The runbook agent gets vLLM and a read-only file system, no network access to live systems. When each agent finishes, its sandbox is destroyed. No state leaks between agents.
How self-hosted sandboxes work
The supervisor pattern builds on the single-agent model from the previous post, which separates the architecture into distinct cloud and infrastructure environments (see Figure 1).
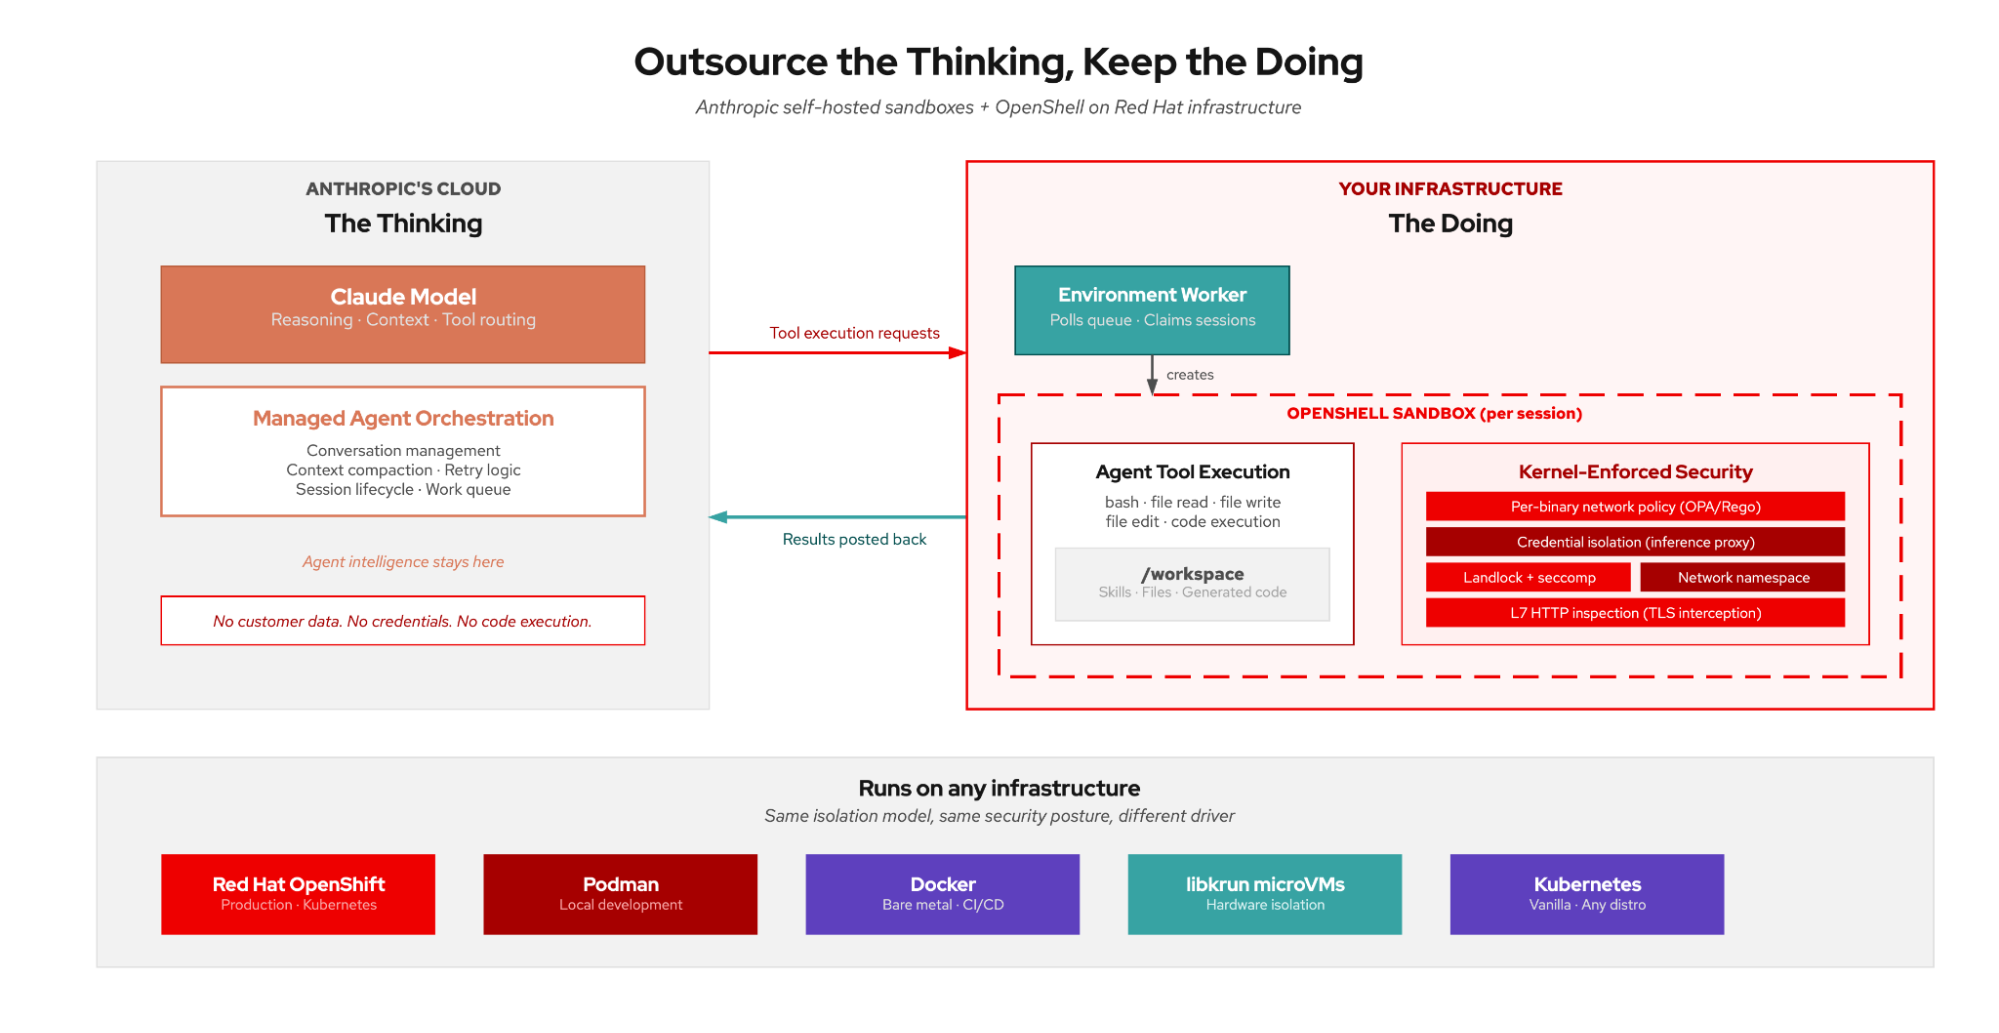
Claude Managed Agents splits an agent into two halves: the brain and the worker.
The brain runs in Anthropic's cloud. It handles reasoning, context management, tool routing, and the agent loop. The brain decides what tool calls to make, but it never executes them. It never touches your data or your infrastructure.
The worker is a pod running on your OpenShift cluster. It does three things: polls Anthropic's work queue (outbound HTTPS), executes tool calls inside OpenShell sandboxes on the cluster, and posts results back. The worker initiates all connections. Anthropic never connects inbound to your cluster.
The environment ties them together. An environment is a named work queue on Anthropic's platform. You create one, get an environment ID and key, and point your worker at it. When someone creates a session targeting your environment, the brain enqueues tool calls and your worker picks them up.
The worker authenticates with a scoped environment key that can only poll for work and post results. It cannot create sessions, list agents, or access other environments. If the key leaks from inside a sandbox, the blast radius is limited to submitting fake tool results to an active session.
A sandbox per session
Anthropic's worker supports a container-per-session mode. Instead of executing tool calls in its own process, the worker delegates each session to a separate OpenShell sandbox using a spawn script:
# The poller dispatches each session to your spawn script
ant beta:worker poll --on-work ./spawn-openshell.sh
The spawn script creates an OpenShell sandbox on the cluster, runs the single-session worker inside it, and tears down the sandbox when the session completes:
#!/bin/bash
# spawn-openshell.sh: called once per session

# Create a sandbox on the cluster gateway
openshell sandbox create \
    --name "session-$ANTHROPIC_SESSION_ID" \
    --gateway cluster-gw \
    --policy /etc/openshell/worker-policy.yaml

# Run the worker inside the sandbox
openshell sandbox exec \
    --name "session-$ANTHROPIC_SESSION_ID" -- \
    env ANTHROPIC_SESSION_ID="$ANTHROPIC_SESSION_ID" \
        ANTHROPIC_ENVIRONMENT_KEY="$ANTHROPIC_ENVIRONMENT_KEY" \
        ANTHROPIC_WORK_ID="$ANTHROPIC_WORK_ID" \
        ANTHROPIC_ENVIRONMENT_ID="$ANTHROPIC_ENVIRONMENT_ID" \
        ANTHROPIC_BASE_URL="$ANTHROPIC_BASE_URL" \
    ant beta:worker run

# Tear down when done
openshell sandbox delete "session-$ANTHROPIC_SESSION_ID"
Each session gets its own file system, its own network namespace, and its own policy. When the session completes, the sandbox is destroyed. No state leaks between sessions.
One brain, many sandboxed agents
As illustrated in Figure 2, the brain (Claude, in Anthropic's cloud) orchestrates. The worker pod on your cluster receives tool calls from the brain and, for each one, creates an OpenShell sandbox with a per-agent security policy. The agent reasoning, the data access, and the model inference all happen inside that sandbox. When the agent finishes, the sandbox is destroyed.
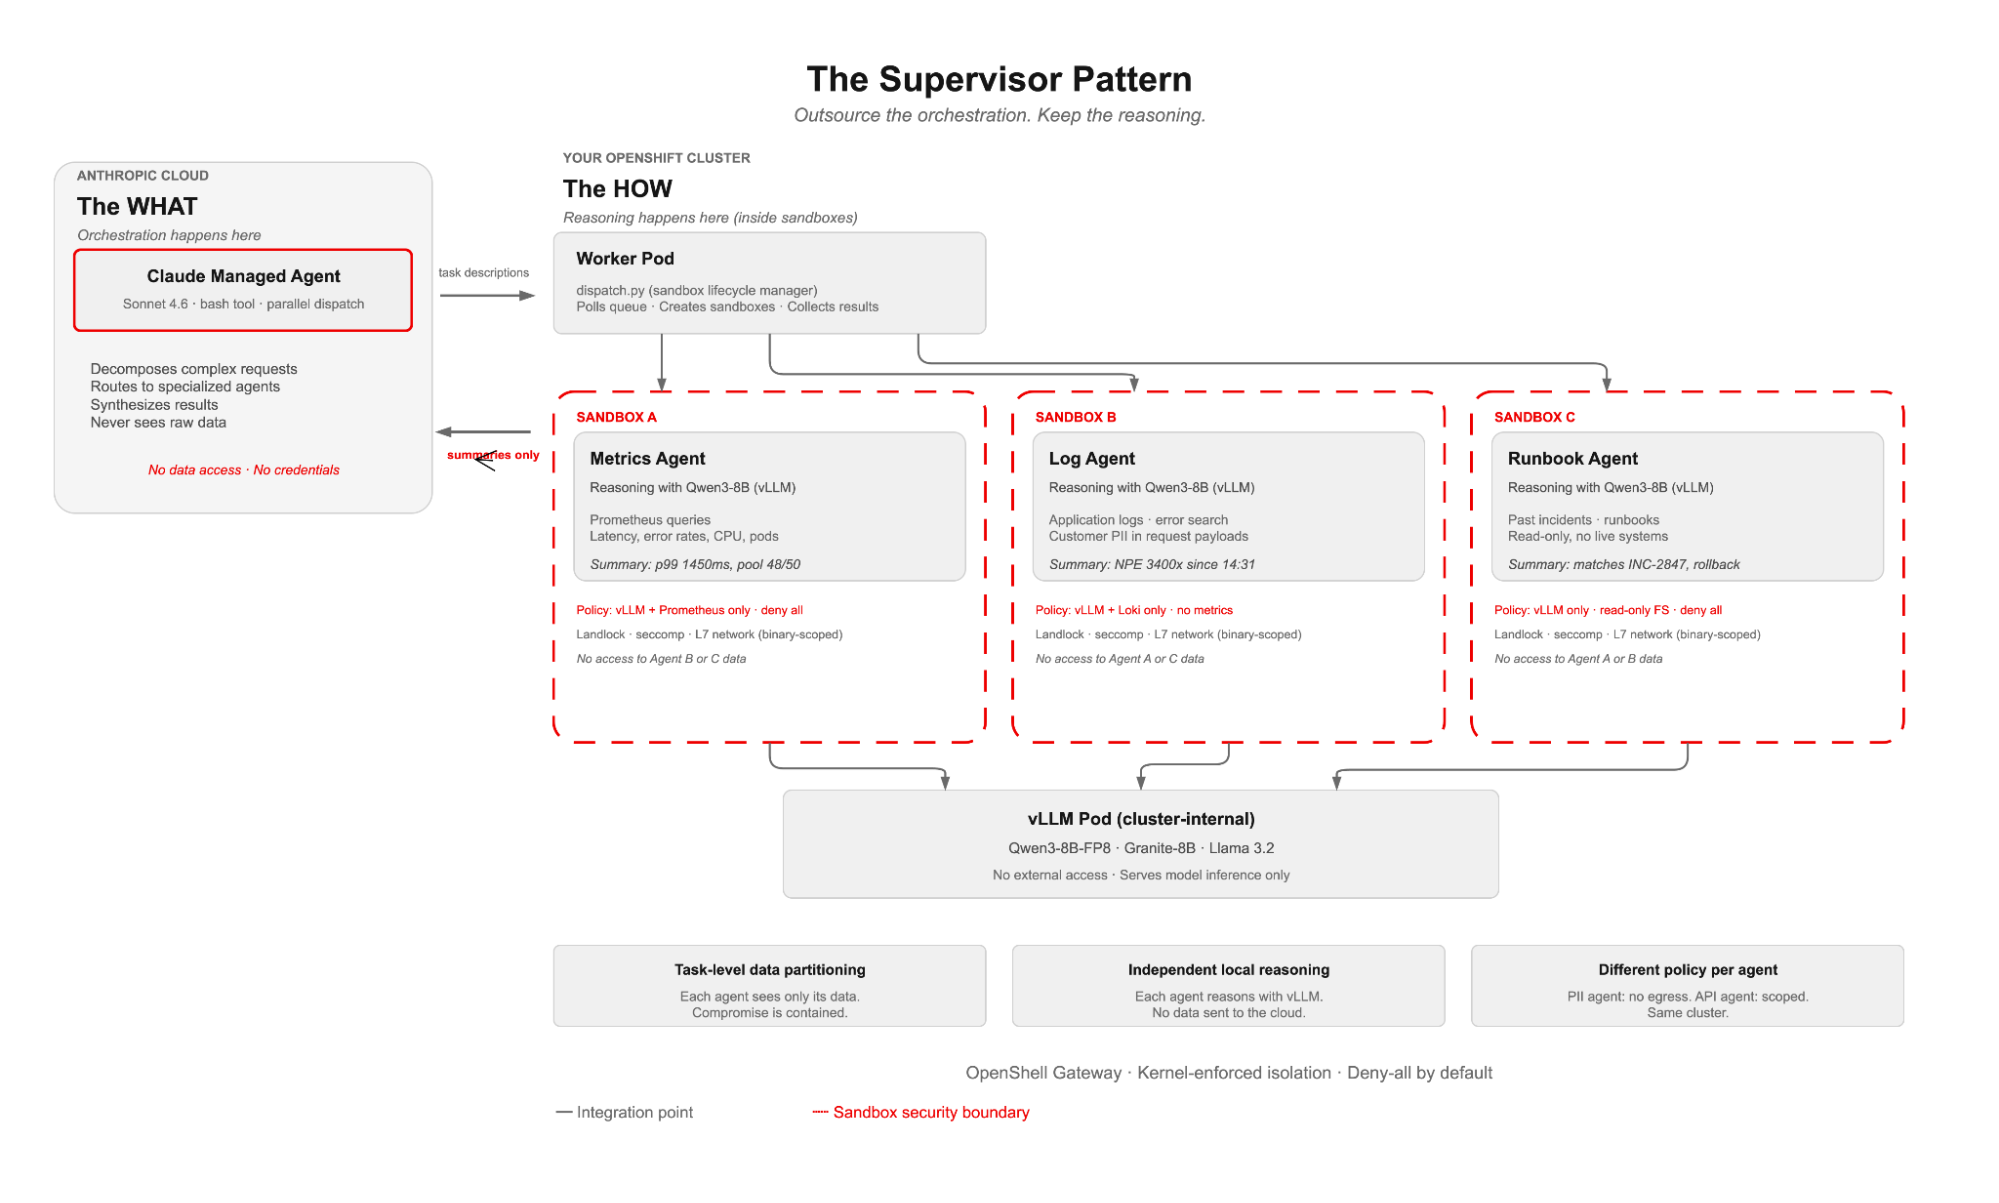
What makes this a supervisor pattern is the split between orchestration and reasoning. The orchestration (task decomposition, agent routing, result synthesis) runs in Anthropic's cloud. The reasoning (reading data, calling models, producing analysis) runs inside OpenShell sandboxes on your cluster. You outsource the coordination to the brain, but keep the actual work in-house.
dispatch.py runs in the worker pod as a thin sandbox lifecycle manager. It creates the sandbox, applies per-agent network policy, runs the agent inside it, collects stdout, and tears it down. It never touches data, calls models, or reasons. All of that happens inside the sandbox, where kernel-level policies (Landlock for the file system, seccomp for syscalls, and L7 network rules per binary) enforce isolation.
The brain decides what to do. The sandboxed agents decide how. Reasoning stays on your cluster. Only summarized results cross back to Anthropic.
How it works
Back to the checkout outage. The brain receives "checkout is down, investigate" and needs to dispatch three parallel investigations: metrics, logs, and runbooks. Each investigation runs inside its own sandbox on the cluster. Here is how the dispatch happens.
The brain's system prompt lists the available agent specializations and how to call them:
You have access to three specialized agents, each running in its
own OpenShell sandbox on the cluster with kernel-enforced policy.

To call an agent, use bash:
  python3 dispatch.py <agent_name> "<task description>"

Available agents:
  metrics_agent  - Queries Prometheus/Grafana for service anomalies
  log_agent      - Searches application logs for errors and exceptions
  runbook_agent  - Searches runbooks and past incidents for matching patterns
When Claude receives an incident report, it produces three parallel tool_use blocks. These are not terminal commands; they are structured tool calls that Anthropic's harness sends to your worker through the work queue:
[tool_use] bash: python3 dispatch.py metrics_agent "Check checkout-service latency, error rates, resource usage"
[tool_use] bash: python3 dispatch.py log_agent "Search checkout-service logs for errors since 14:30 UTC"
[tool_use] bash: python3 dispatch.py runbook_agent "Find past incidents matching connection pool exhaustion"
The worker pod receives these tool calls from the queue. For each one, dispatch.py runs the sandbox lifecycle: create sandbox, install dependencies, apply per-agent network policy, run the agent inside the sandbox, collect the result, tear down. Here is the actual lifecycle for each agent:
# 1. Create a fresh sandbox (default policy allows PyPI for dependency install)
openshell sandbox create --name agent-metrics-agent

# 2. Install the agent's dependencies inside the sandbox
openshell sandbox exec --name agent-metrics-agent -- pip3 install -q openai

# 3. Apply per-agent network policy (live update, binary-scoped)
#    Only python3 inside the sandbox can reach vLLM. Everything else is denied.
openshell policy update agent-metrics-agent \
    --add-endpoint "vllm-svc.ns.svc.cluster.local:443:full:rest:enforce" \
    --binary "/sandbox/.venv/bin/python3" \
    --wait

# 4. Upload agent script and run it INSIDE the sandbox
openshell sandbox exec --name agent-metrics-agent -- \
    python3 /sandbox/agent.py "Check latency, error rates, resource usage"

# 5. Tear down (no state survives)
openshell sandbox delete agent-metrics-agent
Step 3 is where the security model kicks in. openshell policy update is a live policy update on a running sandbox. Before this call, the sandbox can reach PyPI (for pip install) but nothing else. After this call, the sandbox can reach vLLM, scoped to the python3 binary only. The --wait flag blocks until the sandbox proxy has loaded the new policy. Any other process in the sandbox gets a 403 Forbidden if it tries to reach vLLM.
Inside the sandbox, the agent script does the actual work: reads data from local sources, calls Qwen3-8B on vLLM over the cluster-internal network, and produces a summary. The summary prints to stdout, which dispatch.py captures and the ant worker posts back to Anthropic.
We used the openshell CLI here because it makes every step visible. OpenShell also provides a Python SDK, and frameworks like the OpenAI Agents SDK have their own sandbox extension points where OpenShell plugs in as a provider. The pattern is the same regardless of which interface you use.
No separate routing infrastructure, no per-agent environments. The brain's own reasoning handles dispatch. One agent, one environment, one worker. Per-agent isolation happens at the sandbox level, not the queue level. The environment routes work; the sandbox strengthens your security posture.
What the brain sees versus what it does not
The brain sees task descriptions and summarized results. It does not see the raw data.
The log agent searches application logs inside its sandbox and returns NullPointerException in PaymentProcessor.java:142, 3,400 occurrences since 14:31. The brain sees the error summary. The raw log entries, which contain customer request payloads with PII in headers and bodies, stay inside the sandbox on the cluster. The metrics agent returns p99 latency 1450ms, error rate 12.4%. Aggregate numbers, no customer data.
The risk to acknowledge: task descriptions can leak information. "Search logs for user john@example.com" tells Anthropic you have a user named John. The mitigation is abstract task descriptions: "Search checkout-service logs for errors in the 14:30-15:00 UTC window." The agent resolves specifics from local context inside the sandbox.
Per-agent sandbox isolation
Each agent runs in its own OpenShell sandbox on the cluster with its own network policy. The metrics agent cannot see files the log agent created. Neither can reach endpoints the other is allowed to access.
Every sandbox starts with a default policy: PyPI allowed for dependency installation, everything else denied. After setup, dispatch.py narrows the policy to exactly what the agent needs with openshell policy update. Each policy rule requires both an endpoint and a binary. Only the specified executable can reach the specified host on the specified port. Everything else gets a 403 from the sandbox proxy.
We validated this on an OpenShift cluster. Without the policy update, the sandbox blocks vLLM:
DENIED /sandbox/.venv/bin/python3(47) -> vllm-api:443
[policy:- engine:opa]
[reason: endpoint not in policy; binary not allowed]
After openshell policy update --add-endpoint ... --binary ... --wait, the same call succeeds. The proxy logs confirm the policy version loaded and the CONNECT tunnel was allowed.
For the full supervisor pattern, each agent gets a different policy update call with different endpoints:
# Metrics agent: vLLM + Prometheus API
openshell policy update agent-metrics-agent \
    --add-endpoint "vllm-svc:443:full:rest:enforce" \
    --add-endpoint "prometheus.monitoring:9090:full" \
    --binary "/sandbox/.venv/bin/python3" --wait

# Log agent: vLLM + log aggregator API
openshell policy update agent-log-agent \
    --add-endpoint "vllm-svc:443:full:rest:enforce" \
    --add-endpoint "loki.logging:3100:full" \
    --binary "/sandbox/.venv/bin/python3" --wait

# Runbook agent: vLLM only (read-only file system, Landlock-enforced)
openshell policy update agent-runbook-agent \
    --add-endpoint "vllm-svc:443:full:rest:enforce" \
    --binary "/sandbox/.venv/bin/python3" --wait
The metrics agent can reach Prometheus and vLLM. The log agent can reach the log aggregator and vLLM. The runbook agent can reach vLLM only, with a read-only file system. None can reach endpoints outside their policy. None can see each other's data (separate Landlock namespaces). If the log agent gets prompt-injected through a malicious log entry, the attacker can search logs but cannot reach the metrics API, the runbook system, or any external endpoint. The blast radius is one agent's sandbox.
The full flow, from request to results
We built this scenario as a demo and ran it end-to-end on an OpenShift cluster following the structured timeline detailed in Figure 3. The agents query simulated data, but the sandbox lifecycle, policy enforcement, and model inference are real.

The incident
A user reports failed payments on the checkout service. We send a user.message event to the session:
Investigate: users reporting failed payments on checkout-service since 14:30 UTC. Identify root cause, check past incidents, and recommend a fix.The brain decomposes
Claude received the incident report and immediately dispatched three parallel investigations:
[agent.tool_use] bash: python3 dispatch.py metrics_agent "Check checkout-service
    latency, error rates, resource usage, and upstream dependencies since 14:30 UTC"
[agent.tool_use] bash: python3 dispatch.py log_agent "Search checkout-service logs
    14:30-15:00 UTC for errors, exceptions, and deploy events"
[agent.tool_use] bash: python3 dispatch.py runbook_agent "Find past incidents
    matching connection pool exhaustion, OOMKilled, NullPointerException in payments"
The worker dispatches to sandboxes
The worker pod received all three tool calls. For each one, dispatch.py ran the sandbox lifecycle: create sandbox, install dependencies, apply vLLM network policy with openshell policy update --add-endpoint --binary --wait, upload the agent script, execute inside the sandbox with Qwen3-8B on vLLM, collect stdout, delete the sandbox. Three sandboxes, three policy boundaries, three independent investigations:
[tool.result] metrics_agent:
    "p99 latency spiked from 120ms to 1450ms at 14:32 UTC. Error rate: 12.4%.
     CPU: 89%. Database connection pool: 48/50 active (near exhaustion).
     3 pod restarts (OOMKilled). Upstream payment-gateway: healthy."

[tool.result] log_agent:
    "NullPointerException in PaymentProcessor.java:142, 3400 occurrences since 14:31.
     Connection pool exhaustion warnings: 12,000 since 14:30. HikariPool timeout: 890.
     Deploy event: checkout-service-v2.14.3 rolled out at 14:28 UTC."

[tool.result] runbook_agent:
    "INC-2847 (2026-03-15) matches: connection pool exhaustion after deploy.
     Root cause: v2.12.1 introduced connection leak in retry logic.
     Fix: rollback + connection.close() in finally block. Runbook: RB-CHECKOUT-004.
     Time to resolve: 22 minutes."
The brain correlates and synthesizes
Claude connected the dots across all three agent summaries:
Incident Summary: checkout-service payment failures

Timeline:
  14:28  Deploy v2.14.3 rolled out
  14:30  Connection pool warnings begin (12,000 in 30 min)
  14:31  NullPointerException in PaymentProcessor (3,400 occurrences)
  14:32  p99 latency spikes to 1450ms, error rate hits 12.4%

Root cause: v2.14.3 likely introduced a connection leak (same pattern
as INC-2847 from March). Database pool exhausts, causing NPE and
cascading failures.

Recommended fix:
  1. Immediate: rollback to v2.14.2
  2. Follow-up: apply connection.close() in finally block per RB-CHECKOUT-004
  3. Estimated resolution: 22 minutes (based on INC-2847 precedent)
The brain never saw the raw log entries (which contain customer request payloads with PII), the Prometheus time series data, or the internal runbook documents. Each agent queried one system inside its sandbox and returned a summary. The brain correlated the summaries.
In production, each agent would connect to the real monitoring system (Prometheus, Loki, Confluence) over the cluster-internal network. The brain has no network path to those systems. It only sees what the worker prints to stdout.
Two agent loops, two trust domains
Two agent loops run in this architecture. Understanding where each one runs is what makes the security model work.
Loop 1: Anthropic's managed agent harness (their cloud)
Claude produces tool_use blocks in Anthropic's wire format. The harness parses them, sends the bash command to the worker through the work queue, and wraps the worker's stdout in a tool_result block. Claude sees the result and decides what to do next. This loop uses Anthropic's Messages API format and runs entirely in Anthropic's cloud.
Loop 2: Agent script calling vLLM (your cluster, inside a sandbox)
When the worker pod creates a sandbox and runs the agent script inside it, the agent connects to vLLM using the OpenAI-compatible Chat Completions format. Qwen3-8B reasons about the task, returns an answer, and the agent prints the result to stdout. This loop uses OpenAI's wire format and runs entirely on your cluster, inside a sandbox, with policy-enforced network access.
The two loops are independent. Different formats, different models, different trust domains. The brain never calls vLLM. The local agents never call Anthropic. The only things that cross the cluster boundary are the task description (inbound through the work queue) and the summarized result (outbound HTTPS).
| Connection | Where | Format | What crosses |
|---|---|---|---|
| Worker polling Anthropic | Cluster to Anthropic cloud (outbound) | Anthropic messages | Task descriptions |
| Worker posting results | Cluster to Anthropic cloud (outbound) | Anthropic messages | Summarized results only |
| Agent script to vLLM | Cluster-internal (sandbox to vLLM pod) | OpenAI chat completions | Raw data and full reasoning |
Everything is outbound from your cluster. Anthropic never connects inbound. The worker pod initiates all connections. This is why the pattern works behind firewalls with only egress to api.anthropic.com allowed.
When does the supervisor pattern makes sense?
Use the supervisor pattern when your workload touches multiple data sources with different sensitivity levels, requires parallel task execution, or needs a restricted blast radius.
Incident investigation is the example in this post, but the pattern applies to any multi-step workflow where each step accesses different systems. Know Your Customer (KYC) onboarding (identity documents versus fraud databases versus credit models), CI/CD pipelines (code review versus security scan versus deployment), and compliance reviews (transaction data versus regulatory rules versus report templates) all fit.
The supervisor pattern is not ideal for single-step tasks where one sandbox is enough. The per-agent sandbox lifecycle can add latency: sandbox creation, pip install, and policy update (which can also be optimized). For a simple "run this script and return the output" task, one sandbox per session is the right pattern. The supervisor pattern pays off when a single sandbox gives one agent access to more data than it needs.
Next steps
Start with the blast radius question. If a single agent in your workflow gets compromised, what can it reach? If the answer is "more than one system," split the work into per-agent sandboxes. If one system is enough, a single sandbox per session is the right pattern. Match the isolation to the data, not the other way around.
Sandboxing is one layer of a deeper security architecture. For the broader picture of how these layers fit together on Red Hat AI, see:
- Every layer counts: Defense in depth for AI agents with Red Hat AI
- Red Hat AI and OpenShell: Driving security-enhanced agent execution for enterprise AI
- Bringing Claude self-hosted sandboxes to OpenShell on Red Hat AI
- Operationalizing "Bring Your Own Agent" on Red Hat AI, the OpenClaw edition
Finally, if you want to try this yourself, you can explore the supervisor pattern code repository on GitHub.