Latency-sensitive dataplane workloads impose fundamentally different requirements on cloud platforms than traditional IT applications. For these workloads, success is not defined by peak throughput alone, but by predictability, bounded tail latency, and sustained stability under load. This article is intended for platform engineers validating high-performance container platforms, performance architects tuning DPDK workloads, and developers operating latency-sensitive packet processing applications.
This evaluation does not attempt hardware comparison or maximum throughput benchmarking. Instead, it focuses on methodology validation and how to reliably determine the highest sustainable load that preserves latency stability.
Overview of the evaluation
This study is not about publishing record throughput numbers. Instead, it presents a repeatable engineering methodology for identifying stable operating envelopes for latency-sensitive DPDK workloads running on bare-metal Red Hat OpenShift. The focus is on how to systematically discover deterministic performance boundaries, where throughput remains stable and latency remains bounded even under sustained stress.
The approach integrates:
- End-to-end system tuning (BIOS -> Kernel -> OpenShift -> pod)
- SR-IOV with VFIO for near bare-metal I/O
- DPDK TestPMD as a controlled dataplane surrogate
- TRex as a deterministic traffic generator
- Binary-search driven throughput discovery
- Multi-hour stability validation
The outcome is not a single performance number, but a validated and reproducible methodology for engineering determinism.
Why determinism matters more than peak throughput
As dataplane workloads approach saturation, performance degradation is rarely linear. Small increases in offered load can trigger:
- Queue buildup
- Scheduling contention
- Cache pressure
- Tail latency spikes
Short-duration benchmarks often mask these effects. Sustainable operation requires identifying the true stability boundary, not the transient maximum.
For latency-sensitive systems, the correct question is: What is the highest load at which throughput remains stable and latency remains bounded across repeated runs?
This methodology enforces that discipline.
Hardware specifications
The hardware specifications are the foundation for achieving deterministic latency-sensitive dataplane performance on OpenShift.
Control plane:
Role | HW platform | CPU | RAM | OpenShift | Kernel | NICs (PCI) + driver/firmware |
3xMaster | Dell PowerEdge R740xd | 2 sockets, Intel Xeon Gold 6230 @ 2.10GHz, 64 CPUs | ~187.5 GiB | OCP 4.18 | 5.14.0-427.87.1.el9_4.x86_64 | X550 (ixgbe, fw 24.0.5), I350 (igb, fw 24.0.5), XXV710 25GbE (i40e, fw 24.0.5) |
Workers (SR-IOV):
Role | HW platform | CPU (HT) | RAM | OS / OpenShift | Kernel | NICs (PCI) + SR-IOV notes |
|---|---|---|---|---|---|---|
worker1 | Dell PowerEdge R740xd | 2 sockets, Xeon Gold 6230, 40 CPUs (HT off, 40c/40t) | ~187.5 GiB | OCP 4.18 | 5.14.0-427.87.1.el9_4.x86_64 | PFs: Mgmt (X550, I350) , Dataplane [ XXV710 25GbE (i40e fw 23.0.8). SR-IOV VFs present in lspci: “Ethernet Virtual Function 700 Series” (8086:154c) ]. |
Trex Trafficgen node hardware specification:
Role | HW platform | CPU (HT) | RAM | OS | Kernel | NICs + Trex-relevant binding |
Trex | Dell PowerEdge R740xd | 2 sockets, Xeon Gold 6230, 40 CPUs (HT off, 40c/40t) | ~187.0 GiB | RHEL 9.4 | 5.14.0-427.13.1.el9_4.x86_64 | X550 + I350 + Dataplane [ XXV710 25GbE present in PCI. XXV710 is bound to vfio-pci per lspci -nnvv (typical for DPDK/T-Rex), so it won’t appear as a normal Linux netdev. ] |
Software and tooling specifications
Based on the performance and latency analysis conducted using OpenShift SR-IOV and TRex, the following matrix details the essential software components, versions, and specific tooling required to meet the test goals of simulating a high-performance network workload.
Component Category | Version/Configuration Detail | Rationale for Low-Latency Network Performance Testing |
|---|---|---|
Container Platform | OCP 4.18 | Provides a production-grade Kubernetes environment for deploying the Device Under Test (DUT) as a containerized network function (CNF). |
Base OS (OpenShift) | RHCOS 418.94.202509100653-0 | Minimal, immutable operating system for OpenShift workers, ensuring a clean and consistent host environment for low-latency workloads. |
Host Kernel | 5.14.0-427.87.1.el9_4.x86_64 | The base kernel for RHCOS, optimized via Performance Profile Operator (PPO) for real-time/low-latency behavior (nohz_full, idle=poll, etc.). |
Networking Drivers | net_i40e (Implied for Intel XXV710 25GbE NICs on TRex and Worker) | The Poll Mode Driver (PMD) used by DPDK applications (TRex, testpmd) for high-performance, low-latency packet I/O via VFIO. |
Traffic Generation | v3.00 (Used by Crucible's bench-trafficgen profile) | Provides a high-fidelity, highly deterministic, and configurable traffic source capable of generating load and measuring low-rate latency using default software timestamping. |
Dataplane Application | DPDK 23.11.0 (Configuration details: 1 RXQ/1 TXQ, burst=32, forward-mode mac, pinned 4 cores) | The Device Under Test (DUT), simulating a generic packet processing function within the OpenShift SR-IOV pod. Used to validate forwarding capacity and latency. |
Tool / Component | Primary Purpose | Key Capabilities & Metrics | Role in Network Usecases |
Crucible (perftool-incubator) | Performance test automation framework | Integrates multiple perf tools into unified harness- Common data model for results- Can orchestrate tests across endpoints (K8s, remote hosts) (GitHub) | Test automation core: orchestrates multi-tool network KPIs, standardizes results. |
Bench-Trafficgen (perftool-incubator) | Traffic generation control module | Launches traffic gen servers- Binary search based throughput measurement (likely using testpmd) (GitHub) | High-speed traffic generator driver: for throughput/latency/loss profiling. |
Regulus (redhat-performance) | Networking test suite leveraging Crucible | Likely contains pre-built networking tests- Integration with Crucible for automated test runs (GitHub) | Test suite layer: reuses Crucible test engine for network validation automation |
OpenShift SR-IOV Pods | High-performance network pods | Pods with direct NIC hardware acceleration- Bypass kernel for near-native throughput | Under-test platform: simulates application traffic workloads with critical performance requirements. |
Crucible Controller Node / Metrics Backend | Collect, store, and visualize results | - Metrics ingest (Prometheus/ElasticSearch)- Dashboards for latency, throughput, packet loss | Analysis layer: correlate network performance KPIs, focusing on low-latency metrics. |
System tuning: Engineer a low-noise platform
The BIOS configuration intentionally favors determinism over opportunistic boost behavior. BIOS-level tuning eliminates hardware variability.
BIOS Feature | Configuration | Rationale |
SMT | Disabled | Removes shared execution and cache contention |
Turbo Boost | Disabled | Avoids frequency oscillation and thermal jitter |
C-States | Disabled | Eliminates wake-up latency |
CPU Power Management | Max Performance | Minimizing power-saving is precisely the mechanism often used to enhance RFC-loss stability in network tests, as it reduces jitter. |
PCIe ASPM | Disabled | Ensures deterministic DMA latency |
These decisions reduce hardware variability and improve tail-latency stability.
Network topology
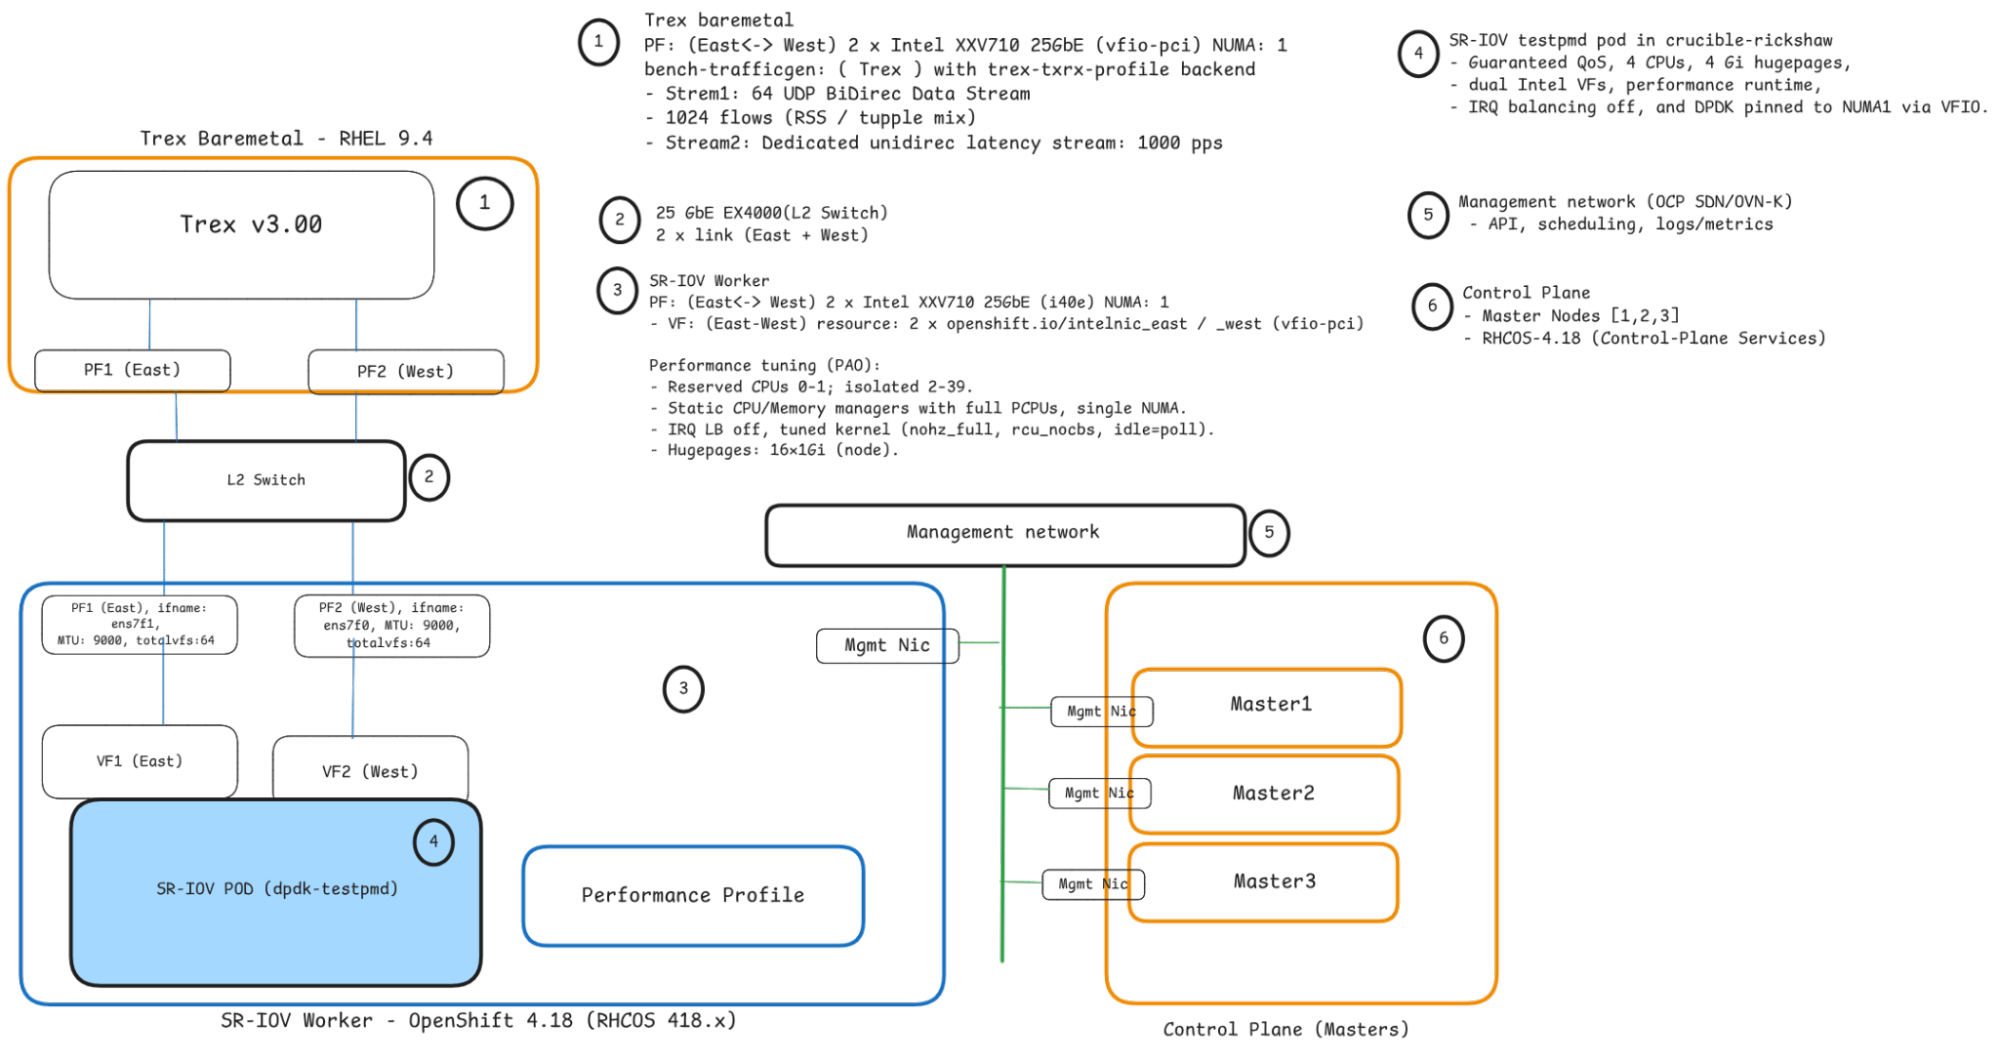
The network topology is designed for achieving consistent, low-latency dataplane performance in OpenShift. This approach transforms a standard OpenShift cluster into a high-performance platform suitable for rigorous network performance testing, focusing on low-latency measurement utilizing Trex's default software time stamping (Figure 1).
Kernel and host tuning via performance profile
Using the performance profile operator, dataplane CPUs were isolated and shielded from kernel activity. Representative kernel arguments include the following example:
- apiVersion: performance.openshift.io/v2

  kind: PerformanceProfile

  metadata:

    finalizers:

    - foreground-deletion

    generation: 3

    name: reghwol

  spec:

    additionalKernelArgs:

    - nohz_full=2-39

    - nmi_watchdog=0

    - audit=0

    - processor.max_cstate=1

    - idle=poll

    - intel_idle.max_cstate=0

    - mce=off

    - tsc=reliable

    - rcu_nocb_poll

    - rcupdate.rcu_normal_after_boot=0

    cpu:

      isolated: 2-39

      reserved: 0,1

    globallyDisableIrqLoadBalancing: true

    hugepages:

      defaultHugepagesSize: 1G

      pages:

      - count: 16

        size: 1G

    kernelPageSize: 4k

    machineConfigPoolSelector:

      machineconfiguration.openshift.io/role: reghwol

    net:

      userLevelNetworking: false

    nodeSelector:

      node-role.kubernetes.io/reghwol: ""

    numa:

      topologyPolicy: single-numa-node

    realTimeKernel:

      enabled: false

    workloadHints:

      highPowerConsumption: true

      perPodPowerManagement: false

      realTime: false
Key objectives:
- Eliminate scheduler noise
- Prevent interrupt balancing across dataplane cores
- Pre-allocate 1GiB hugepages
- Enforce NUMA alignment
This creates a stable execution domain for userspace packet processing.
Owning the dataplane with SR-IOV and VFIO
Why use SR-IOV with VFIO? This configuration establishes a high-performance, low-latency OpenShift dataplane using SR-IOV to dedicate two physical function (PF) ports (ens7f0, ens7f1) as virtual functions (VFs), which are then bound to VFIO/DPDK for userspace networking. The VFs are consumed by pods via two network attachment definitions (NADs) (east-testpmd-sriov-network, west-testpmd-sriov-network) to create isolated, high-speed, symmetric East/West paths with Jumbo Frames (MTU 9000), specifically for benchmarking network workloads.
apiVersion: k8s.cni.cncf.io/v1

kind: NetworkAttachmentDefinition

metadata:

  name: east-sriov-net

spec:

  config: |

    {

      "cniVersion": "0.3.1",

      "type": "sriov",

      "resourceName": "openshift.io/intelnic_east",

      "deviceType": "vfio-pci",

      "trust": "on",

      "spoofchk": "on"

    }
The use of SR-IOV with VFIO/DPDK is a critical optimization because it bypasses the standard Linux kernel network stack to achieve significantly lower and more stable p99/p999 latency and higher PPS/throughput. By employing polling instead of interrupts, the design eliminates unpredictable latency spikes, resulting in a more predictable, fixed CPU cost per packet, essential for strict latency targets.
Furthermore, features like dedicated resource naming, NUMA alignment, and host network isolation ensure high determinism and reduced run-to-run variability in benchmark results. The trust:on setting is key for enabling advanced hardware offloads required by advanced packet processing pipelines.
Pod-level optimizations
The SR-IOV pod configuration achieves a guaranteed quality of service (QoS) by setting identical resource requests and limits for dedicated CPUs, 1Gi HugePages, and specific SR-IOV virtual functions (VFs).
Engineering Insight: This setup is the standard for high-performance, low-latency network applications like testpmd.
Key optimizations include:
- CPU pinning (guaranteed QoS and
performance-reghwol runtime): Ensures the application runs on isolated, high-priority cores, eliminating scheduler noise and throttling, which is vital for stable packet processing and low jitter. - SR-IOV direct path: Bypasses the standard Linux networking stack and OVN overlay, drastically reducing overhead to achieve maximum packet per second (PPS) and minimal latency with 64B frames.
Here is an example resource declaration:
cpu_partitioning : 1

qosClass: Guaranteed

resources:

  limits:

    cpu: "4"

    hugepages-1Gi: 4Gi

    openshift.io/intelnic_east: 1

    openshift.io/intelnic_west: 1

  requests:

    cpu: "4"

    hugepages-1Gi: 4Gi

    openshift.io/intelnic_east: 1

    openshift.io/intelnic_west: 1

securityContext:

  capabilities:

     add:

        SYS_ADMIN

        IPC_LOCK

        SYS_ADMIN
This guarantees:
- No CPU throttling
- No overcommit
- Stable memory behavior
- Predictable scheduling
Traffic generation strategy: Separate load from measurement
To measure latency under stress without perturbing the system, we divided traffic into two streams.
Load stream:
- High-rate traffic
- 64-byte UDP frames
- 1024 concurrent flows
- Used to drive dataplane utilization
Latency probe:
- Fixed 1000 packets per second
- Separate stream
- Used exclusively to measure queueing behavior
This separation prevents measurement traffic from influencing system load dynamics.
TRex: Deterministic traffic as an appliance
TRex is an open source, high-performance L2–L7 traffic generator. It simulates realistic, stateful, and stateless traffic at line rate on standard x86 hardware. For network performance, TRex emulates large-scale stateless and stateful traffic patterns to stress dataplane forwarding pipelines under controlled, repeatable conditions.
Key tuning aspects:
- Dedicated CPU pinning and NUMA alignment
- Hugepage-backed memory
- VFIO NIC access
- Dedicated latency threads
- Fail-fast RX queue behavior
Example: trex_cfg.yaml
-   c: 14

    interfaces:

    - 0000:87:00.0

    - 0000:87:00.1

    limit_memory: 2048

    platform:

        dual_if:

        -   socket: 1

            threads:

            - 35

            - 33

            - 31

            - 29

            - 27

            - 25

            - 23

            - 21

            - 19

            - 17

            - 15

            - 13

            - 11

            - 9

        latency_thread_id: 37

        master_thread_id: 39

    port_bandwidth_gb: 25

    port_info:

    -   default_gw: 2.2.2.2

        ip: 1.1.1.1

    -   default_gw: 1.1.1.1

        ip: 2.2.2.2

    version: 2
Representative invocation (example):
./_t-rex-64-o -i --checksum-offload --cfg .../trex_cfg.yaml --iom 0 -v 4 --prefix trafficgen_trex_ --close-at-endThe TREX generator is exhaustively tuned as a deterministic, low-jitter appliance for high-fidelity network dataplane simulation. Key optimizations include: aggressive OS-level noise reduction (CPU partitioning, nohz_full, idle=poll), use of 1Gi hugepages, VFIO passthrough for high-performance networking, explicit thread pinning to a single NUMA socket (Socket 1), and a fail-fast queue drop configuration to prioritize latency consistency over maximizing throughput in overload scenarios. This comprehensive tuning strategy ensures stable throughput and optimized tail latency.
Binary search: Enforce stability by design
To validate deterministic dataplane behavior under stress, we used a binary-search load discovery method instead of linear ramp-up. This is critical because network dataplanes exhibit non-linear behavior near saturation, making it essential to find the highest sustainable operating point with deterministic latency, not just peak throughput.
The binary search efficiently converges on the stability threshold. The traffic model used a deterministic TRex profile with 64-byte UDP frames, 1024 concurrent flows, and a dedicated 1000 pps latency probe to ensure accurate measurements under stress.
We tested four directional scenarios (bi-directional/unidirectional load vs. bi-directional/unidirectional probe) to expose system asymmetries. We explored the load via checkpoints (1% to 80% line rate) and evaluated against strict criteria: stable throughput, bounded latency, and reproducibility. The algorithm consistently converged on 60% bi-directional load as the highest sustainable point before latency variance increased.
We achieved further determinism using binary-search tuning options like --stream-mode=segmented, --search-granularity=0.05, and --random-seed=42, significantly reducing latency standard deviation.
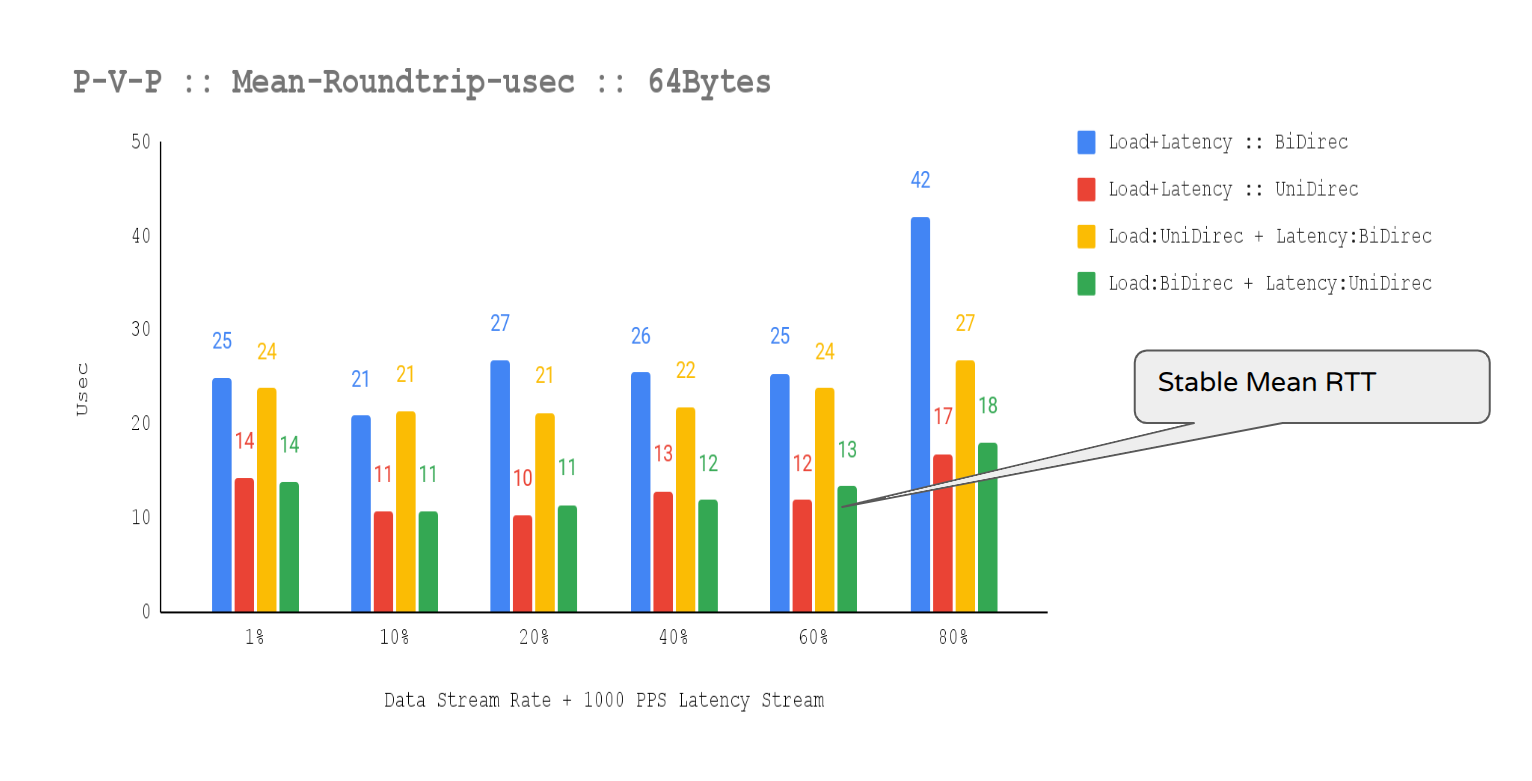
The optimal operating point selected for durability validation was 60% bi-directional load with a unidirectional 1000 pps latency probe, which consistently delivered stable throughput and bounded, repeatable latency with minimal jitter (Figures 2-4).
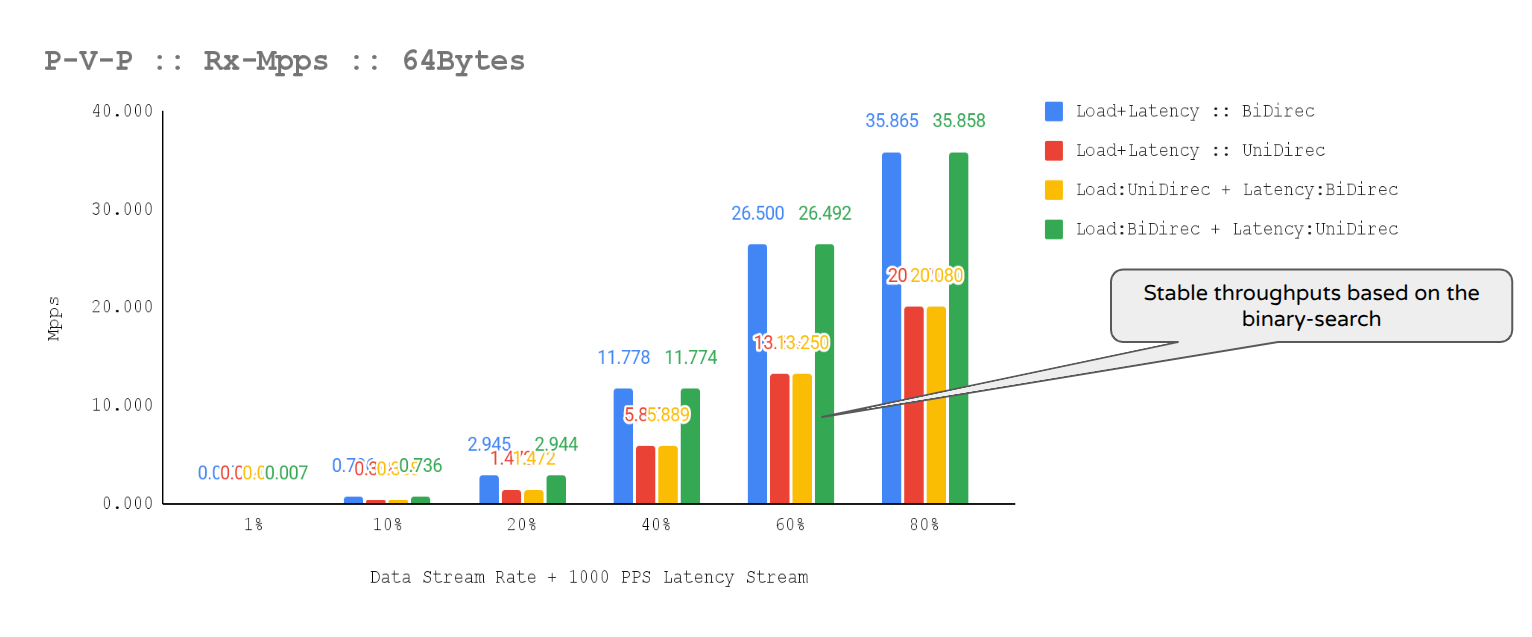
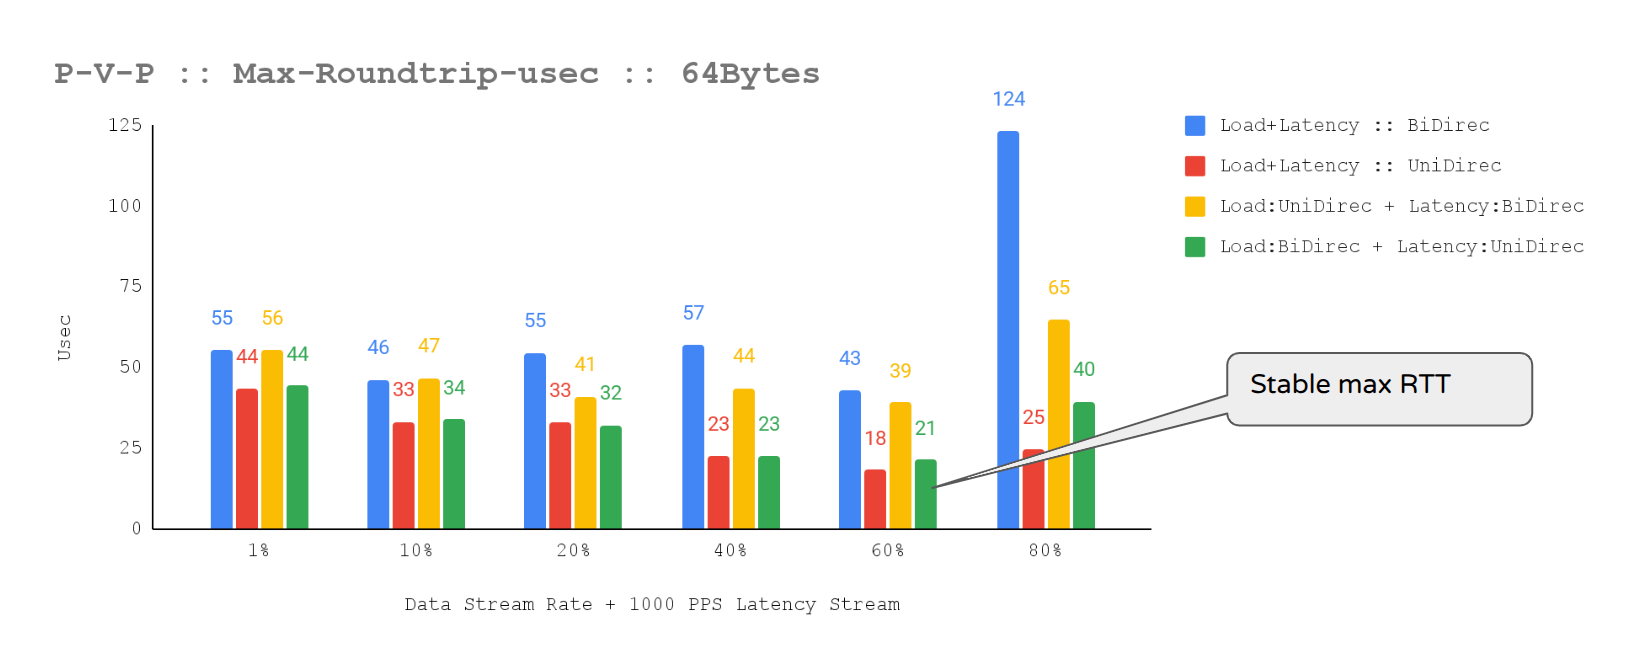
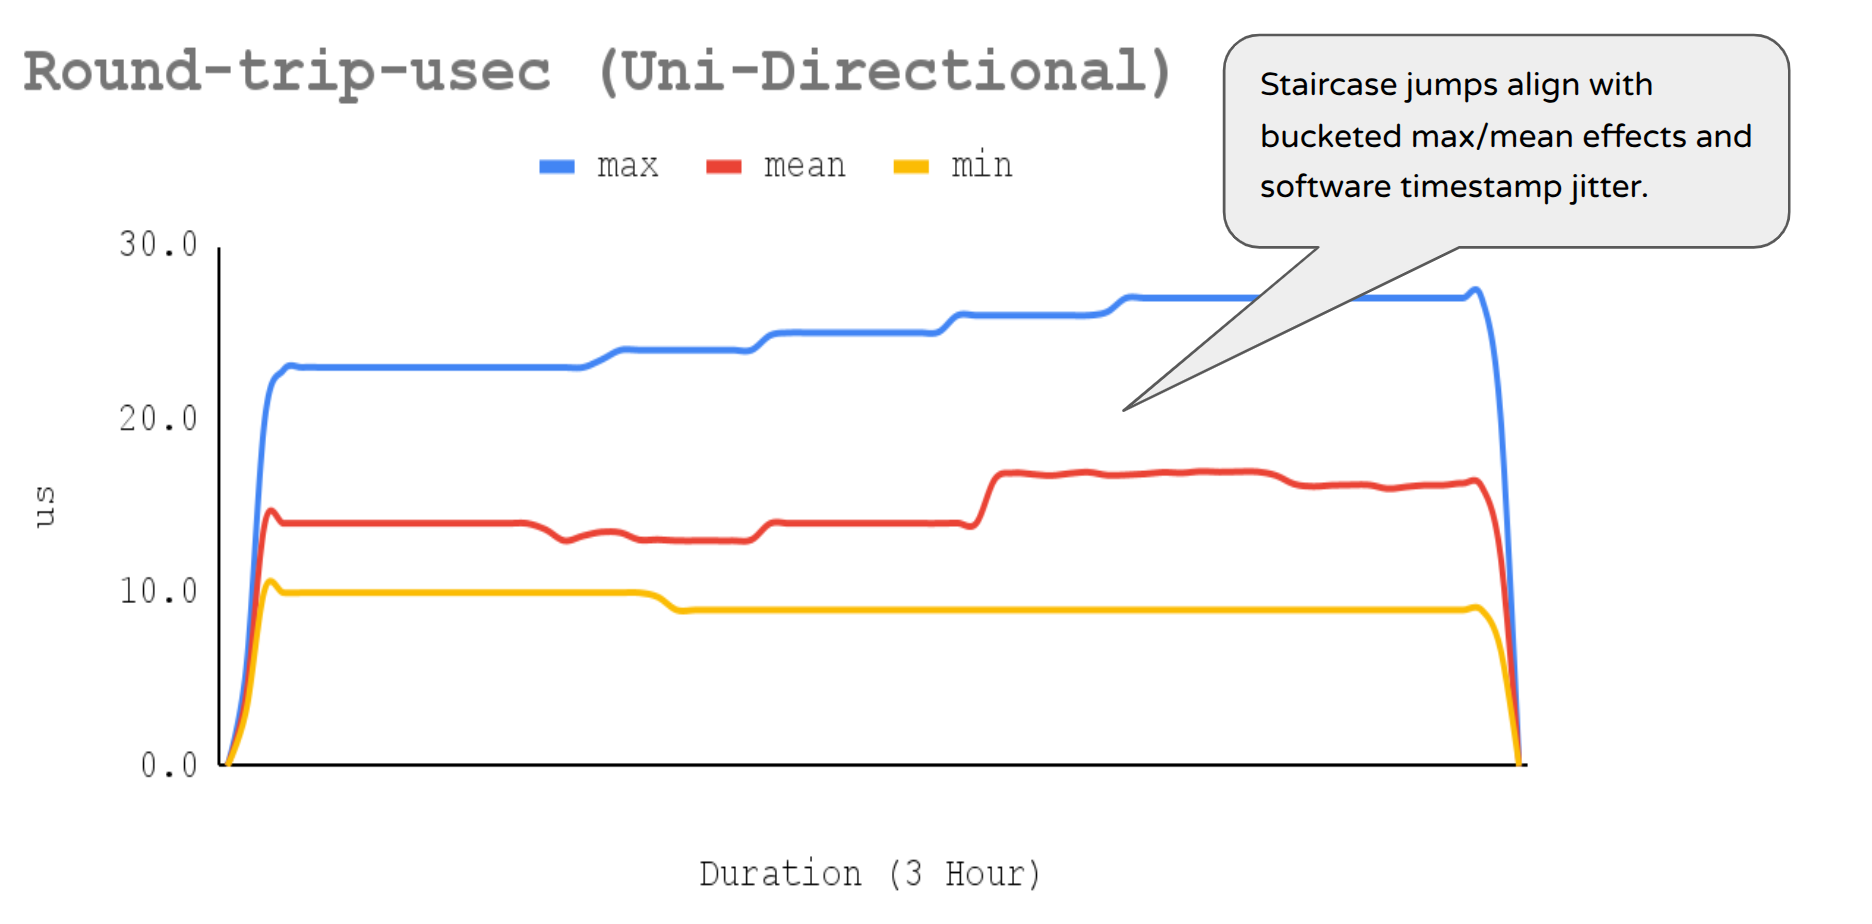
Figure 3: This chart shows 1000 pps latency stream MAX-RTT (unidirectional traffic).
This configuration was subsequently used for a three-hour durability test, providing high confidence that the platform can sustain deterministic latency-sensitive workloads within the limits of the evaluated hardware.
Converged operating point
Across repeated trials, the system consistently converged at 60% bi-directional load and 1000 pps uni-directional latency probe. Although 80% was technically reachable, latency variance increased beyond acceptable deterministic thresholds. Then a three-hour sustained durability test validated the selected configuration, confirming stability.
Why the results are credible
The final operating point shows deterministic behavior across key independent signals: stable bidirectional throughput, tightly bounded maximum latency with no spikes, effective CPU isolation keeping forwarding cores pinned in userspace with minimal interrupt noise, and system stability free of memory pressure or scheduler interference. Representative metrics are shown; extended outputs are omitted for brevity since they confirm these stable patterns.
Example:
binary-search.py --traffic-generator trex-txrx-profile --traffic-profile trafficgen.profile --rate-unit % --min-rate 1 --rate 60 --latency-rate 1000 --one-shot 0 --search-runtime 30 --validation-runtime 10800 --stream-mode segmented --warmup-trial --send-teaching-warmup --teaching-warmup-packet-type generic --teaching-measurement-packet-type generic --teaching-warmup-packet-rate 100 --teaching-measurement-packet-rate 100 --teaching-measurement-interval 10.0 --rate-tolerance 5 --runtime-tolerance 5 --rate-tolerance-failure fail --max-loss-pct 0.002 --search-granularity 0.05 --random-seed 42 --disable-upward-search --compress-files --result-output none --process-all-profiler-data --dst-macs=AA:AA:AA:AA:AA:AA,BB:BB:BB:BB:BB:BB --output-dir /tmp/iteration-1/sample-1 --device-pairs=0:1 --active-device-pairs=0:1Example (trafficgen.profile):
{

  "streams": [

    {

      "flows": 1024,

      "frame_size": 64,

      "flow_mods": "function:create_flow_mod_object(use_src_mac_flows=False, use_dst_mac_flows=False, use_src_ip_flows=False, use_dst_ip_flows=True, use_src_port_flows=False, use_dst_port_flows=False, use_protocol_flows=False)",

      "rate": 29761904,

      "frame_type": "generic",

      "protocol": "UDP",

      "stream_types": [

        "teaching_warmup",

        "teaching_measurement",

        "measurement"

      ],

      "latency": false,

      "traffic_direction": "bidirectional",

      "stream_id": "stream1"

    },

    {

      "flows": 1024,

      "frame_size": 64,

      "flow_mods": "function:create_flow_mod_object(use_src_mac_flows=False, use_dst_mac_flows=False, use_src_ip_flows=False, use_dst_ip_flows=True, use_src_port_flows=False, use_dst_port_flows=False, use_protocol_flows=False)",

      "rate": 1000,

      "frame_type": "generic",

      "protocol": "UDP",

      "stream_types": [

        "teaching_warmup",

        "teaching_measurement",

        "measurement"

      ],

      "latency": true,

      "latency_only": true,

      "traffic_direction": "unidirectional",

      "stream_id": "stream2"

    }

  ]

}
The binary-search runner explicitly enforces:
- Loss target: max_loss_pct = 0.002% (very strict)
- Rate tolerance: ±5%
- Latency measurement enabled with latency_rate=1000 (scaled by offered load)
- Flows: 1024, 64B UDP bidirectional
The algorithm optimizes and explicitly rejects unstable operating points even if short-term throughput appears higher. The following findings validated the final operating point.
Throughput flatness over time:
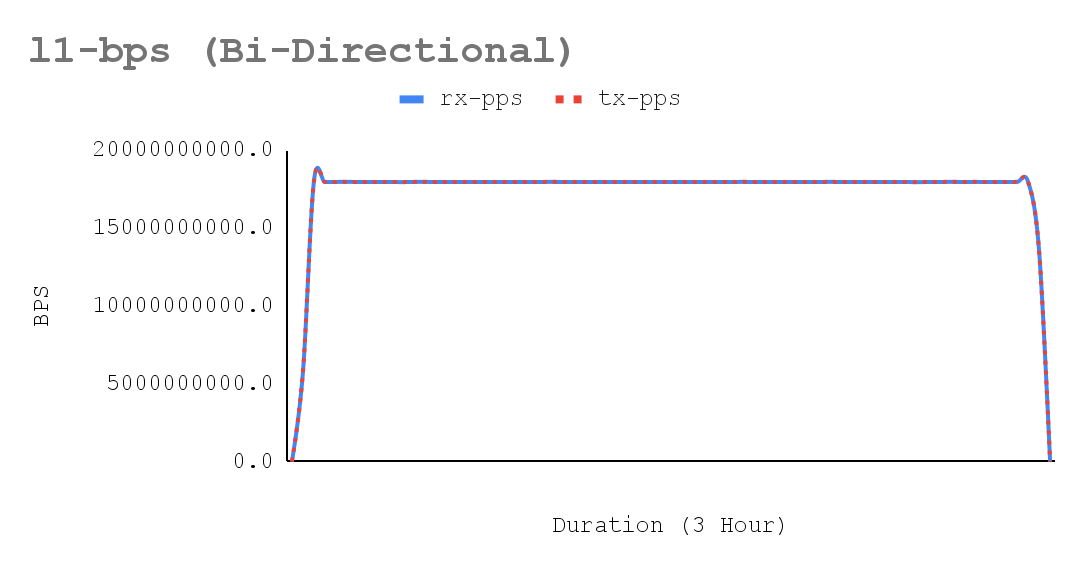
- The traffic metrics show stable bidirectional ~13.36 Mpps/per-direction with L1 RX ~8.98 Gbps per direction and T‑Rex port util ~35.9% (flat over the window), while T‑Rex CPU utilization remains modest (TX ~14, RX ~0.005). Because link utilization is far from line rate and the generator is not CPU-saturated, the achieved rate is bounded by the dpdk-testpmd forwarding-core capacity, not by the NIC or T‑Rex. The flatness of PPS and utilization confirms deterministic forwarding behavior, which is essential to maintain deterministic behavior under sustained 64B/1024-flow load with a dedicated latency stream.
crucible get metric --run 869e5a07-feb4-4872-be7b-996af43682c1 --period 400258E8-D730-11F0-AA86-B2D00212E703 --begin 1765515198842 --end 1765526025254 --source trafficgen --type rx-pps --breakout port_pair,rx_port,tx_port

                                              12-12-2025

     source   type port_pair rx_port tx_port    07:53:45

--------------------------------------------------------

 trafficgen rx-pps       0:1       0       1 13360184.86

 trafficgen rx-pps       0:1       1       0 13360783.40


crucible get metric --run 869e5a07-feb4-4872-be7b-996af43682c1 --period 400258E8-D730-11F0-AA86-B2D00212E703 --begin 1765515198842 --end 1765526025254 --source trafficgen

--type l1-rx-bps --breakout port_pair,rx_port,tx_port

                                                   12-12-2025

     source      type port_pair rx_port tx_port      07:53:45

-------------------------------------------------------------

 trafficgen l1-rx-bps       0:1       0       1 8978044225.14

 trafficgen l1-rx-bps       0:1       1       0 8978446441.53


crucible get metric --run 869e5a07-feb4-4872-be7b-996af43682c1 --period 400258E8-D730-11F0-AA86-B2D00212E703 --begin 1765515198842 --end 1765526025254 --source trafficgen

--type l2-rx-bps --breakout port_pair,rx_port,tx_port


                                                   12-12-2025

     source      type port_pair rx_port tx_port      07:53:45

-------------------------------------------------------------

 trafficgen l2-rx-bps       0:1       0       1 6412888732.24

 trafficgen l2-rx-bps       0:1       1       0 6413176029.66


crucible get metric --run 869e5a07-feb4-4872-be7b-996af43682c1 --period 400258E8-D730-11F0-AA86-B2D00212E703 --begin 1765515198842 --end 1765526025254 --source trafficgen-trex-profiler  --type rx-port-util --breakout rx_port


                                               12-12-2025

                   source         type rx_port   07:53:45

---------------------------------------------------------

 trafficgen-trex-profiler rx-port-util       0      35.92

 trafficgen-trex-profiler rx-port-util       1      35.92


crucible get metric --run 869e5a07-feb4-4872-be7b-996af43682c1 --period 400258E8-D730-11F0-AA86-B2D00212E703 --begin 1765515198842 --end 1765526025254 --source trafficgen-trex-profiler  --type tx-port-util --breakout tx_port


                                               12-12-2025

                   source         type tx_port   07:53:45

---------------------------------------------------------

 trafficgen-trex-profiler tx-port-util       0      35.92

 trafficgen-trex-profiler tx-port-util       1      35.92


crucible get metric --run 869e5a07-feb4-4872-be7b-996af43682c1 --period 400258E8-D730-11F0-AA86-B2D00212E703 --begin 1765515198842 --end 1765526025254 --source trafficgen-trex-profiler --type tx-cpu-util

                                      12-12-2025

                   source        type   07:53:45

------------------------------------------------
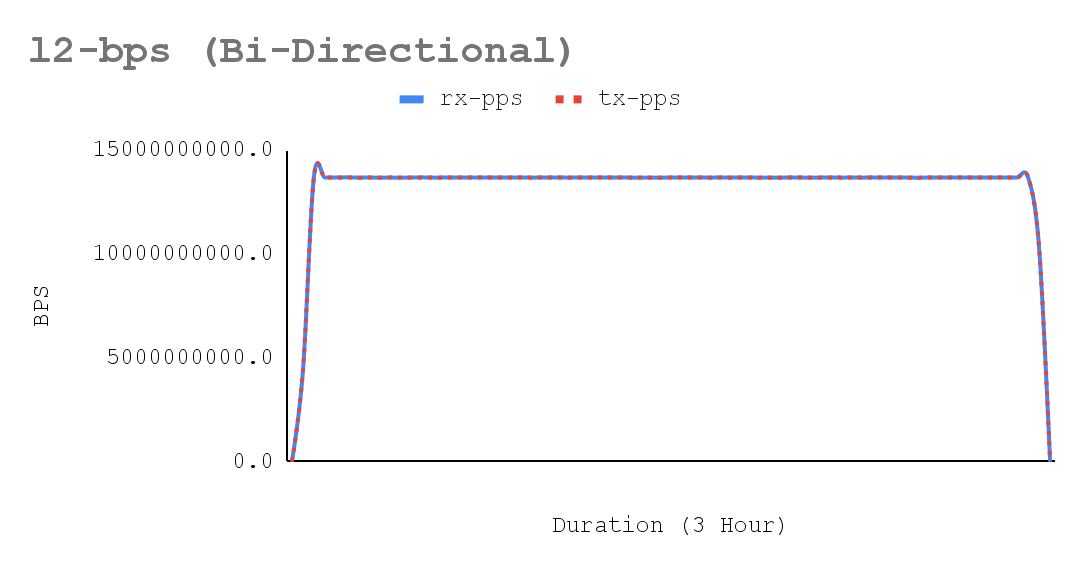
trafficgen-trex-profiler tx-cpu-util 14.01- Figures 5-7 show a sustained network throughput test, using the trafficgen-trex-profiler metrics types, demonstrated the deterministic stability of performance over the test duration. The x-axis of the accompanying chart plots 3-hour validation time across 70 resolutions collected by crucible metrics, confirming consistent results for bi-directional traffic. Key metrics tracked include Stream-PPS, L2-BPS (Layer 2), and L1-BPS (Layer 1).
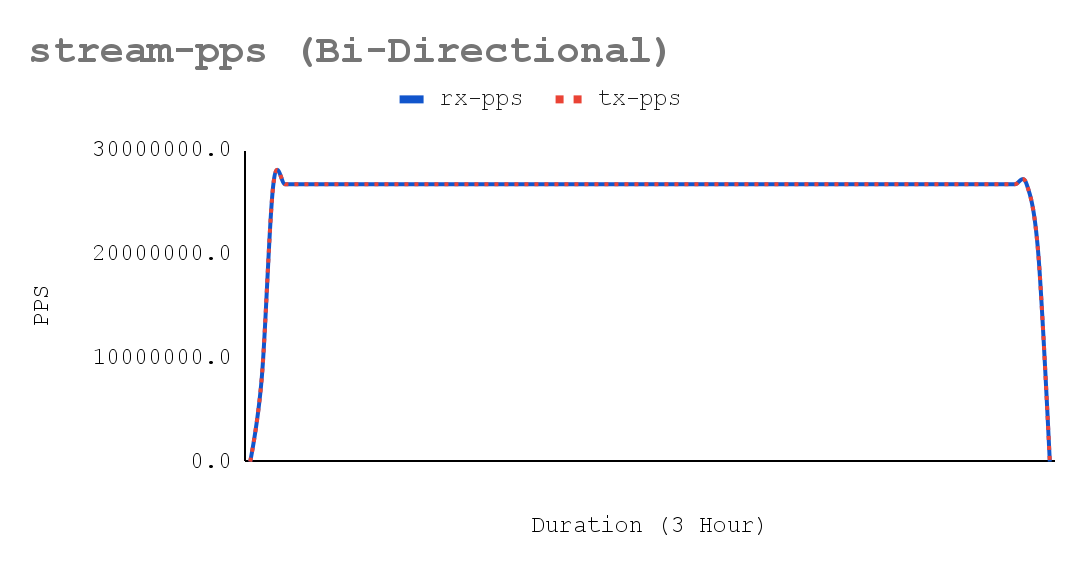
There were no tail-latency spikes with minimal jitter.
The T-Rex latency stream on port-pair 0:1 showed stable mean RTT (≈ 16 µs) and max RTT (27 µs), with no spikes, even while sustaining ~13.36 Mpps per direction and saturated, pinned dpdk-testpmd forwarding lcores. This low jitter and strong tail-latency control is crucial for latency-sensitive network validation, as max-latency excursions (often linked to packet loss) were absent. With T-Rex software timestamping (resolution=70), the RTT series displayed expected stepwise quantization: stable min (9–10 µs), a modest shift in mean (≈14 → 16 µs), and max stabilizing at ~27 µs after small early steps. These staircase jumps are consistent with bucketed max/mean behavior and SW-timestamp jitter/rounding, and, given stable PPS and clean DPDK lcore behavior, do not indicate a consistency problem for the 1000pps latency stream.
crucible get metric --run 869e5a07-feb4-4872-be7b-996af43682c1 --period 400258E8-D730-11F0-AA86-B2D00212E703 --begin 1765515198842 --end 1765526025254 --source trafficgen-trex-profiler --type max-round-trip-usec --breakout stream


                                                     12-12-2025

                   source                type stream   07:53:45

---------------------------------------------------------------

 trafficgen-trex-profiler max-round-trip-usec   1063      25.01


crucible get metric --run 869e5a07-feb4-4872-be7b-996af43682c1 --period 400258E8-D730-11F0-AA86-B2D00212E703 --begin 1765515198842 --end 1765526025254 --source trafficgen-trex-profiler --type mean-round-trip-usec --breakout stream


                                                      12-12-2025

                   source                 type stream   07:53:45

----------------------------------------------------------------

 trafficgen-trex-profiler mean-round-trip-usec   1063      14.92


crucible get metric --run 869e5a07-feb4-4872-be7b-996af43682c1 --period 400258E8-D730-11F0-AA86-B2D00212E703 --begin 1765515198842 --end 1765526025254 --source trafficgen-trex-profiler --type min-round-trip-usec --breakout stream


                                                     12-12-2025

                   source                type stream   07:53:45

---------------------------------------------------------------

 trafficgen-trex-profiler min-round-trip-usec   1063       9.33
Figure 8 illustrates staircase jumps that align with bucketed max/mean effects and software timestamp jitter.
There is stable CPU isolation.
On worker node, the crucible mpstat time series shows CPU5 and CPU9 (testpmd forwarding lcores) pinned at ~100% userspace with ~0.18–0.20% hard-IRQ and ~0% softirq, while housekeeping load and interrupts are concentrated on reserved CPUs 0–1. This “clean” interrupt profile is a key enabler for latency-sensitive network high-PPS tests: it minimizes jitter on dataplane cores, reducing RFC loss spikes and stabilizing the dedicated 1000pps latency stream under T-Rex’s 64B/1024-flow realtime profile.
crucible get metric --run 869e5a07-feb4-4872-be7b-996af43682c1 --period 400258E8-D730-11F0-AA86-B2D00212E703 --begin 1765515198842 --end 1765526025254 --source mpstat --type Busy-CPU --breakout hostname=y37-h13-000-r740xd,num,type --filter gt:0.5


                                                      12-12-2025

 source     type hostname=y37-h13-000-r740xd num type   07:53:45

----------------------------------------------------------------

 mpstat Busy-CPU          y37-h13-000-r740xd   5  usr       1.00

 mpstat Busy-CPU          y37-h13-000-r740xd   9  usr       1.00


crucible get metric --run 869e5a07-feb4-4872-be7b-996af43682c1 --period 400258E8-D730-11F0-AA86-B2D00212E703 --begin 1765515198842 --end 1765526025254 --source mpstat --type NonBusy-CPU --breakout hostname=y37-h13-000-r740xd,num,type --filter gt:0.5

                                12-12-2025

 source        type hostname=y37-h13-000-r740xd num type   07:53:45

-------------------------------------------------------------------

 mpstat NonBusy-CPU          y37-h13-000-r740xd   0 idle       0.57

 mpstat NonBusy-CPU          y37-h13-000-r740xd   1 idle       0.62

 mpstat NonBusy-CPU          y37-h13-000-r740xd   2 idle       1.00

 mpstat NonBusy-CPU          y37-h13-000-r740xd   3 idle       0.98

 mpstat NonBusy-CPU          y37-h13-000-r740xd   4 idle       1.00

 mpstat NonBusy-CPU          y37-h13-000-r740xd   6 idle       1.00

 mpstat NonBusy-CPU          y37-h13-000-r740xd   7 idle       1.00

 mpstat NonBusy-CPU          y37-h13-000-r740xd   8 idle       1.00

 mpstat NonBusy-CPU          y37-h13-000-r740xd  10 idle       1.00

 mpstat NonBusy-CPU          y37-h13-000-r740xd  11 idle       1.00

 mpstat NonBusy-CPU          y37-h13-000-r740xd  12 idle       1.00

 mpstat NonBusy-CPU          y37-h13-000-r740xd  13 idle       1.00

 mpstat NonBusy-CPU          y37-h13-000-r740xd  14 idle       1.00

 mpstat NonBusy-CPU          y37-h13-000-r740xd  15 idle       1.00

 mpstat NonBusy-CPU          y37-h13-000-r740xd  16 idle       1.00

 mpstat NonBusy-CPU          y37-h13-000-r740xd  17 idle       1.00

 mpstat NonBusy-CPU          y37-h13-000-r740xd  18 idle       1.00

 mpstat NonBusy-CPU          y37-h13-000-r740xd  19 idle       1.00

 mpstat NonBusy-CPU          y37-h13-000-r740xd  20 idle       1.00

 mpstat NonBusy-CPU          y37-h13-000-r740xd  21 idle       1.00

 mpstat NonBusy-CPU          y37-h13-000-r740xd  22 idle       1.00

 mpstat NonBusy-CPU          y37-h13-000-r740xd  23 idle       1.00

 mpstat NonBusy-CPU          y37-h13-000-r740xd  24 idle       1.00

 mpstat NonBusy-CPU          y37-h13-000-r740xd  25 idle       1.00

 mpstat NonBusy-CPU          y37-h13-000-r740xd  26 idle       1.00

 mpstat NonBusy-CPU          y37-h13-000-r740xd  27 idle       1.00

 mpstat NonBusy-CPU          y37-h13-000-r740xd  28 idle       1.00

 mpstat NonBusy-CPU          y37-h13-000-r740xd  29 idle       1.00

 mpstat NonBusy-CPU          y37-h13-000-r740xd  30 idle       1.00

 mpstat NonBusy-CPU          y37-h13-000-r740xd  31 idle       1.00

 mpstat NonBusy-CPU          y37-h13-000-r740xd  32 idle       1.00

 mpstat NonBusy-CPU          y37-h13-000-r740xd  33 idle       1.00

 mpstat NonBusy-CPU          y37-h13-000-r740xd  34 idle       1.00

 mpstat NonBusy-CPU          y37-h13-000-r740xd  35 idle       1.00

 mpstat NonBusy-CPU          y37-h13-000-r740xd  36 idle       1.00

 mpstat NonBusy-CPU          y37-h13-000-r740xd  37 idle       1.00

 mpstat NonBusy-CPU          y37-h13-000-r740xd  38 idle       1.00

 mpstat NonBusy-CPU          y37-h13-000-r740xd  39 idle       1.00
Stable interrupt handling:
The PF interrupt rates are extremely low and stable, and they are pinned to CPUs not used by the testpmd lcores. This is exactly what we want for the T-Rex profile (64B + 1024 flows + 1000pps latency stream) which indicates the dataplane is not being driven by kernel RX interrupts, so the forwarding loop is dominated by user-space polling/predictable CPU service time.
crucible get metric --run 869e5a07-feb4-4872-be7b-996af43682c1 --period 400258E8-D730-11F0-AA86-B2D00212E703 --begin 1765515198842 --end 1765526025254 --source procstat --type interrupts-sec --breakout cstype=profiler,hostname=y37-h13-000-r740xd,desc | grep i40e

 procstat interrupts-sec        profiler          y37-h13-000-r740xd i40e-0000:87:00.0:misc       0.20

 procstat interrupts-sec        profiler          y37-h13-000-r740xd i40e-0000:87:00.1:misc       0.20

 procstat interrupts-sec        profiler          y37-h13-000-r740xd     i40e-ens7f0-TxRx-0       0.05

 procstat interrupts-sec        profiler          y37-h13-000-r740xd     i40e-ens7f0-TxRx-1       0.06

 procstat interrupts-sec        profiler          y37-h13-000-r740xd    i40e-ens7f0-TxRx-12       0.21

 procstat interrupts-sec        profiler          y37-h13-000-r740xd    i40e-ens7f0-TxRx-39       0.00

 procstat interrupts-sec        profiler          y37-h13-000-r740xd     i40e-ens7f1-TxRx-0       0.05

 procstat interrupts-sec        profiler          y37-h13-000-r740xd     i40e-ens7f1-TxRx-1       0.06

 procstat interrupts-sec        profiler          y37-h13-000-r740xd    i40e-ens7f1-TxRx-12       0.21

 procstat interrupts-sec        profiler          y37-h13-000-r740xd    i40e-ens7f1-TxRx-39       0.00
No memory or scheduler interference:
- On worker node, sar-mem shows near-zero paging-in (KB-Paged-in-sec ≈ 0 with one tiny spike), indicating the DPDK/testpmd dataplane remained resident and avoided page-fault/IO stalls-critical for sustaining T-Rex 64B/1024-flow load and a stable 1000pps latency stream. KB-Paged-out-sec is steady at ~5–8 MB/s, consistent with background reclaim/writeback activity; because page-ins remain negligible and DPDK lcores stayed stable, this did not present a memory-pressure risk to realtime forwarding in this run.
crucible get metric --run 869e5a07-feb4-4872-be7b-996af43682c1 --period 400258E8-D730-11F0-AA86-B2D00212E703 --begin 1765515198842 --end 1765526025254 --source sar-mem --type KB-Paged-in-sec


                         12-12-2025

  source            type   07:53:45

-----------------------------------

 sar-mem KB-Paged-in-sec       0.31


crucible get metric --run 869e5a07-feb4-4872-be7b-996af43682c1 --period 400258E8-D730-11F0-AA86-B2D00212E703 --begin 1765515198842 --end 1765526025254 --source sar-mem --type KB-Paged-out-sec


                          12-12-2025

  source             type   07:53:45

------------------------------------

sar-mem KB-Paged-out-sec 6436.79- On worker nodes during the test window, scheduler metrics show Run Queue Length ~5–7 and 15-minute load average rising from ~2.5 to ~6.3. This elevated system load is consistent with a DPDK poll-mode workload plus normal cluster/host runnable activity; critically, earlier per-CPU mpstat confirms the testpmd forwarding lcores (CPU5/CPU9) stayed pinned and clean (≈100% userspace, near-zero softirq). This indicates the performance profile successfully contained background scheduling pressure away from dataplane cores - an essential condition to meet T-Rex’s 64B/1024-flow throughput while keeping the 1000pps latency stream stable and minimizing loss spikes.
crucible get metric --run 869e5a07-feb4-4872-be7b-996af43682c1 --period 400258E8-D730-11F0-AA86-B2D00212E703 --begin 1765515198842 --end 1765526025254 --source sar-scheduler --type Run-Queue-Length --breakout hostname=y37-h13-000-r740xd


                                                            12-12-2025

        source             type hostname=y37-h13-000-r740xd   07:53:45

----------------------------------------------------------------------

 sar-scheduler Run-Queue-Length          y37-h13-000-r740xd       5.94


crucible get metric --run 869e5a07-feb4-4872-be7b-996af43682c1 --period 400258E8-D730-11F0-AA86-B2D00212E703 --begin 1765515198842 --end 1765526025254 --source sar-scheduler --type Load-Average-15m --breakout hostname=y37-h13-000-r740xd


                                                            12-12-2025

        source             type hostname=y37-h13-000-r740xd   07:53:45

----------------------------------------------------------------------

 sar-scheduler Load-Average-15m          y37-h13-000-r740xd       4.07
Hardware context and future research
The evaluation platform used a Cascade Lake architecture with a 25G-class XXV710 NIC. This was a suitable environment for methodology validation but does not include advanced silicon offloads or hardware time-stamping capabilities.
Future research will explore IceLake or advanced processor architectures with Intel E810 NICs, including validations for features such as Dynamic Device Personalization (DDP) and precision time protocol (PTP) hardware timestamping.
These capabilities will allow deeper exploration of classification pipelines and sub-microsecond latency measurement directly in hardware. The goal is to combine silicon-level acceleration with disciplined load discovery techniques to further refine deterministic performance envelopes.
Key engineering takeaways:
- Determinism must be engineered across the entire stack.
- Sustainable operating points are more meaningful than peak values.
- Binary search removes subjective tuning bias.
- Must separate load and latency streams.
- Resource guarantees are non-negotiable.
- Sustained validation is essential for credibility.
Wrap up
Achieving deterministic performance for latency-sensitive DPDK workloads on OpenShift requires disciplined systems engineering, not aggressive throughput chasing. By combining end-to-end platform tuning, userspace I/O ownership, and a binary-search driven validation strategy, it is possible to identify stable operating envelopes that preserve bounded and repeatable latency under load. This work builds upon prior Red Hat engineering research on DPDK latency optimization in OpenShift. Refer to articles DPDK latency on OpenShift and DPDK latency in OpenShift, Part 2, extending the focus beyond raw latency tuning to include load-aware convergence and reproducible stability validation. The methodology demonstrated here provides a structured framework for evaluating latency-sensitive dataplane workloads in containerized environments.
While the hardware used in this study was suitable for methodology validation rather than advanced silicon feature exploration, the principles remain portable. Future evaluation on next-generation CPU and NIC architectures will further enhance classification depth and precision timestamping capabilities. Ultimately, the value of this approach lies not in a single benchmark result, but in the confidence it provides. By prioritizing determinism, reproducibility, and sustained validation, engineering teams gain a reliable foundation for operating high-performance DPDK workloads on OpenShift.