You have probably already heard about the service mesh concept and one of its leading implementations, Istio. In the 3scale engineering team at Red Hat, we are working on a component to extend the functionality of Istio (and Red Hat’s distribution, Maistra) by integrating some API Management features via the 3scale platform. In this article, I'll describe this work and some of the decisions made along the way.
3scale provides a range of authentication patterns, access control, and rate limiting features and analytics. The 3scale Istio adapter provides a way for new and existing 3cale users to quickly integrate services running in Istio with this functionality.
Istio provides a mechanism to build a custom back end, which gets called by the Mixer component to make decisions about, or act on, traffic flowing through the mesh. These custom back ends are known as “adapters” and take the form of a gRPC server, typically written in Go, leveraging the code generation utilities and integration testing framework provided by Istio.
End users create some custom resources within their Kubernetes or Red Hat OpenShift cluster, which informs Istio that requests to specific services should be managed and authorized by 3scale.
As traffic flows through the mesh, services marked for API management will have their requests forwarded to the 3scale Istio adapter, which in turn calls out to 3scale (SaaS or on-premises), to determine if the request should be accepted or rejected.
Increasing performance
As you can see, this introduces the risk for our adapter to become a bottleneck for traffic within the service mesh. We are adding an extra network hop between the adapter and 3scale, and potentially a relatively large amount of latency, depending on where 3scale is deployed.
To mitigate this, we decided that this would be a good use case for caching. Caching responses from 3scale authorization endpoints (authentication and rate-limit checking) would enable us to make authorization decisions within the adapter, reducing a network hop and associated latency.
A side effect of implementing this internal cache is that it benefits the 3scale platform itself by serving as a means to provide back pressure. Requests could be incremented and sent in batches at appropriate intervals, reducing network I/O and the load on 3scale.
As with any architectural decision in software, there are tradeoffs, of course. With the cache in place, we increase performance at the cost of potentially allowing some requests that may have gone over their rate limit boundaries through to the upstream service.
Having a large and sudden spike in requests at a given moment may cause this inconsistency to surface. However, this is not a typical use case and past experience has told us that customers are willing to take the hit here and are happy to accept the performance gain for these short-term inconsistencies.
Implementation
To achieve this vision, we needed some type of data structure that would be able to store data by keys, support concurrent access, and perform fast lookups. This is what a (concurrent) hash table—also known as a hash map, dictionary, or lookup table—is meant for.
As of Golang 1.9, the standard library introduced a concurrent safe map which can be used for this purpose. However, we also wanted to look at some third-party packages and evaluate if any of them might perform better, or expose additional API’s that might be beneficial to us when implementing this feature.
Identifying candidates
The criteria for selection prior to evaluation was as follows:
- Open source with an acceptable license.
- Support in-memory data storage.
- Minimum dependencies—the package should have a low number, or ideally zero third-party dependencies, as each of these in itself could be seen as a form of technical debt.
- In widespread use—the package should be reasonably well deployed. Such packages are more likely to have performance issues and vulnerabilities reported back to the project maintainers.
- Well maintained—Any third-party package must be both stable and active.
Once we had selected a handful of potential candidates, we began to develop some benchmarks against our use case to measure and compare the performance of the various packages. This would ultimately be the deciding factor, with decisions potentially swayed for small performance inferiorities against useful features, as well as the latter two criteria identified previously.
A shortlist was decided via the GoDoc search feature, to reduce the selection pool to popular packages matching the above criteria, before doing due diligence on the public repositories code and community.
The following five packages were chosen for selection:
- The built-in sync.Map
- concurrent-map
- beego cache
- go-cache
- cache2go
Benchmarking
The golang testing package provides a benchmarking facility which makes writing benchmarks seem eerily familiar to anyone who has previously written unit tests with the language’s built-in constructs.
Creating a set of benchmarks with table-driven tests plays nicely with what we are trying to achieve here, because it allows us to plug in an interface (the various caching implementations) and a set of workloads (simulate load on the cache).
In regard to simulating a real-world use case, we expect our cache to initially be hit with many writes, before becoming eventually stable, and from then on, receive mainly reads and updates, with few deletions and further additions. Therefore, this is the usage we will focus on.
Furthermore, just for clarity, we are not overly interested in how fast or optimized each package is. We just wanted to visualize how they stacked up against each other and gauge relative performance. For various benchmarks, we would pass a defined workload to each implementation and gather results on the time taken to complete this workload to the full extent. Each workload would consist of a large number of operations.
The benchmarks and graphs in the following sections were run on and produced on a macOS X machine running a 2.5 GHz i7 processor and 16GB of RAM. For validation, the same benchmarks were run on an m5a.xlarge instance in AWS.
Benchmarking cache warmup
To begin, we wanted to see how each implementation would behave during cache warmup (writes only) for varying amounts of clients. A data structure that performed well during warmup but poorly for the rest of its lifecycle would perhaps skew results favorable towards itself without warrant.
To start with, we simulated a cache warmup with 100,000 unique keys. Keys and content were of universal size and type. So, in this instance, the workload was 100,000 writes to the data structure fired off concurrently. The results for the time taken to complete this workload is measured in milliseconds.
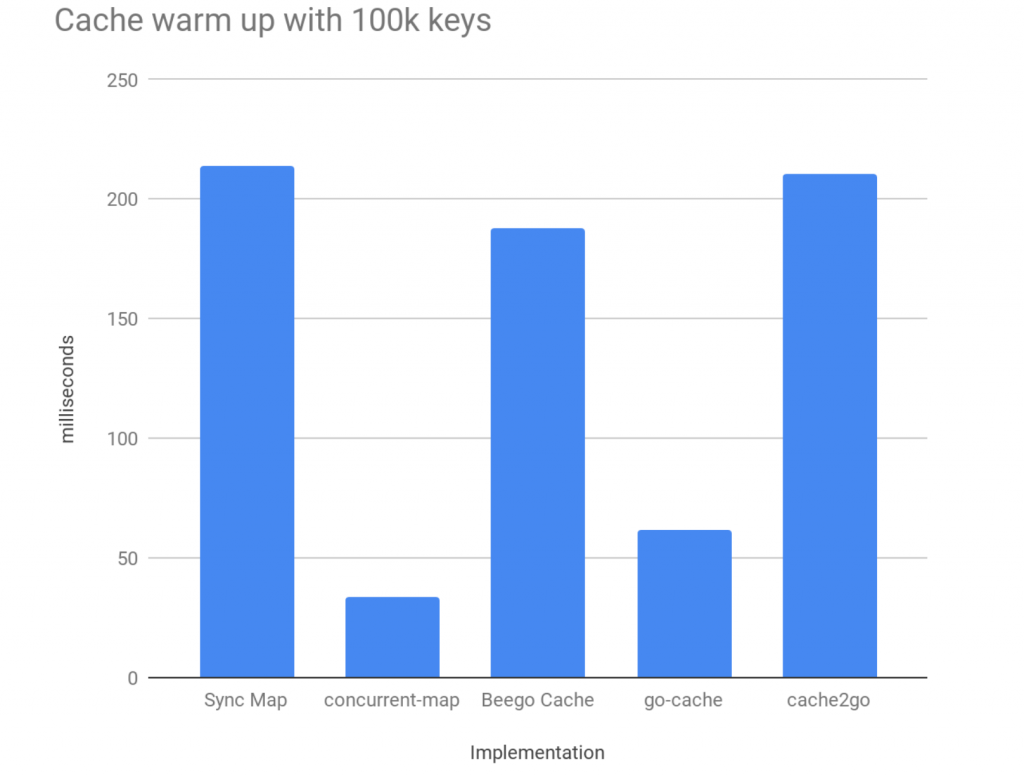
We can see that some data structures significantly outperform others for this workload. To visualize the impact of appending to the data structure and see how it scales, the same benchmarks were run against one million entries:
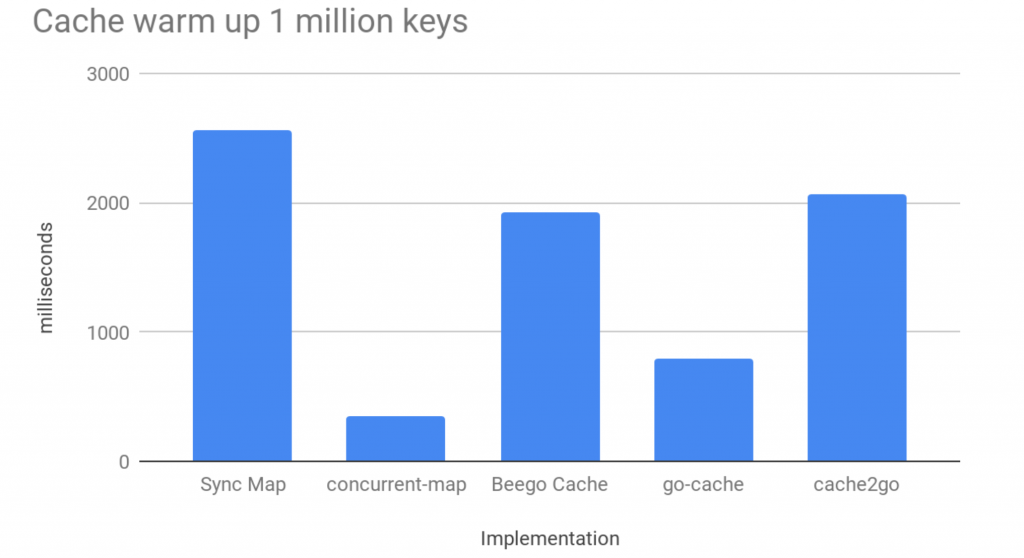
The concurrent map from the standard library is starting to perform more poorly than other implementations. This is not a major surprise, because the documentation calls this out specifically:
“The Map type is optimized for two common use cases: (1) when the entry for a given key is only ever written once but read many times, as in caches that only grow, or (2) when multiple goroutines read, write, and overwrite entries for disjoint sets of keys. In these two cases, use of a Map may significantly reduce lock contention compared to a Go map paired with a separate Mutex or RWMutex.”
This description happens to fit the use case we described earlier quite well, so this implementation should not be ruled out on the basis of these results.
Benchmarking with workload
The next set of benchmarks aimed to build on the previous one and simulate some real-life load on the data structure. Once the initial cache warmup was completed as before, with 100,000 keys, we would provide each implementation with an increasing amount of workload iterations (500, 1000, 1500, 2000, 2500, 3000, 3500, 4000, 4500, 5000).
For each iteration, we would kick off a total of 18 Go routines. Of these, 10 of these would be read-only, six would be responsible for editing the value of existing keys, and the final two would delete a key and value before adding it back to the cache again.
This work would be carried out concurrently. When all the work for that total iteration value was done, this was marked as a single operation and the time taken to complete that operation was measured.
In an attempt to get the most accurate results possible by mitigating the effect of noise and external factors on results, each implementation was run a total of 10 times for each iteration, and the average results across the 10 runs taken and plotted for each workload.
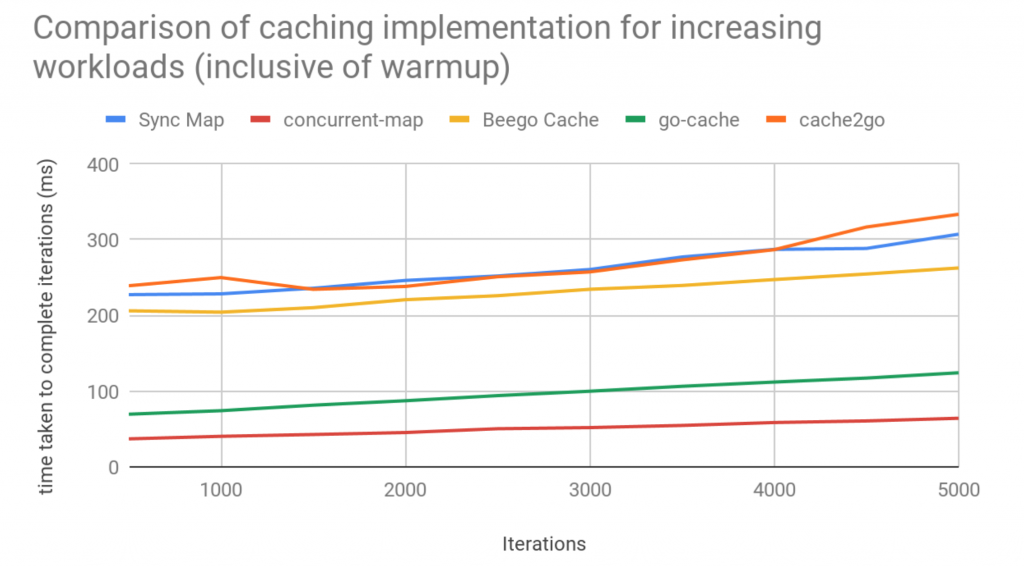
From the graph, we can see that two of the implementations significantly out-performed the others. At this point, we began to discuss and weigh up the benefits of the features provided by the “go-cache” implementation, as opposed to going with the more raw, but performant “concurrent-map” implementation.
It was a matter of making an educated guess at this stage, because, for total accuracy, we would need to benchmark the final implementation, which we envisaged, wrapped around “concurrent-map” against “go-cache.” This was obviously impossible for something not built at this point.
Before we got into too much detailed discussion, we wanted to use the data we had collected up to now to visualize one additional scenario.
Extrapolating steady-state performance
We wanted to determine how an adapter, which was running reliably and had gained a large amount of uptime would perform with the various caches.
We had already determined how long it had taken to warm up the cache for each implementation, as well as how they appeared to compare over time with varying load. Finally, we wanted to compare how the caches stacked against each other after the initial warmup. We could obtain (roughly at least), this data by subtracting the averages gained in the first benchmark from the second. The results (log scale) were as follows:
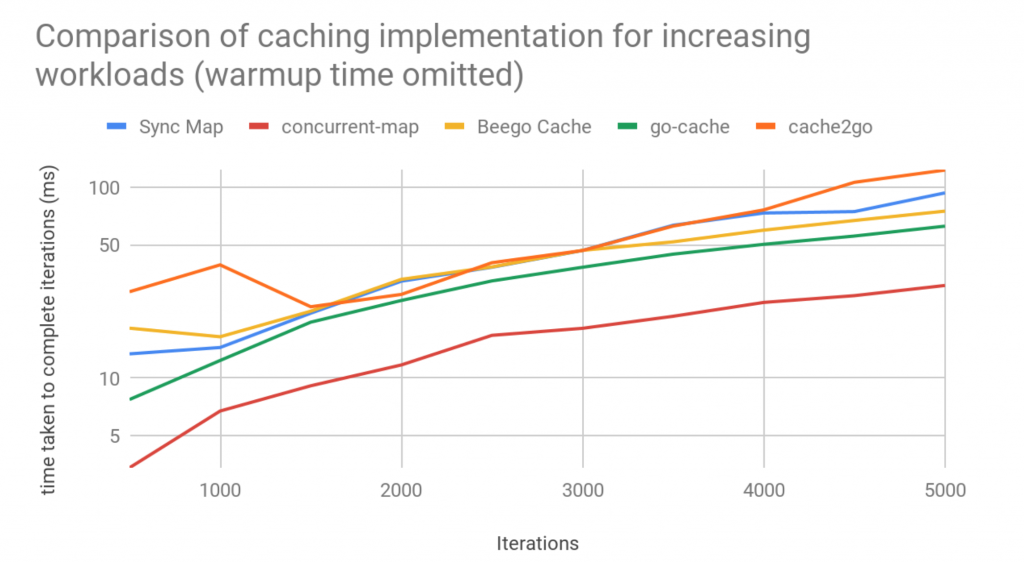
This graph shows us that in the long term, only one of the implementations will significantly outperform the others. With the warmup discounted, the other implementations tend to be tightly aligned.
Conclusion
In the end, we chose to go with the “concurrent-map” implementation and roll our own caching structure around this map. It outperformed the others consistently and in every area for the use case we provided.
The additional features this implementation provides are minimal, but this is likely all we will need, with some additional sugar provided by a wrapper. It is in widely used and has plenty of contributors, with a nice simple API.
We hope that, upon completion, we can then benchmark the finished module against the other implementations, to see if this decision was correct and to analyze and learn from the cost of rolling our own, both in terms of time spent and performance as opposed to using something off the shelf.
Other points
- The code for our gRPC adapter is fully open source and available on GitHub—see 3scale-istio-adapter.
- The benchmarks have been pushed to the benchmarks branch.
