80 failed jobs, each with a trace log reaching 50,000 lines. That was a typical Monday morning for our platform team after a nightly build across multiple GPU and CPU architectures, where a single missing dependency could paint the entire dashboard red.
Faced with this scenario, an engineer staring at the wall of red must execute 3 time-intensive tasks: Read enough logs to comprehend the failures, identify which failures stem from a shared root cause, and file accurate bug reports. While 80 failures often distill down to just 3 underlying problems, discovering those 3 needles in the haystack requires hours of manual investigation.
When exploring solutions for AI in CI/CD, the common instinct is to throw a large language model at the entire pipeline. We explored that path initially. The resulting reports were non-deterministic, inference costs scaled linearly with log volume, and the model would have exhausted its context limits reformatting data it could have simply copied.
Experience teaches us that constraints breed resilient systems. We built the Pipeline Failure Analyzer (PFA) on a strict architectural principle: AI touches exactly 1 of 5 pipeline stages. The other 4 stages are log cleaning, report assembly, ticket creation, and wiki publishing, all of which are handled securely by deterministic Python. The AI intervenes only where human-like causal reasoning is strictly required to group failures and diagnose root causes.
The ratio 1 to 5 is the most important design decision in the system. In this post, we explore the architectural reasoning behind this constraint, examine the implementation, and provide a deterministic log cleaner you can integrate into your own pipelines today. .
Architecture of constraint
A resilient automation system separates data transformation from logical inference. Here is how PFA structures that separation:
- Prepare: Clean raw logs and extract error signals
- Timeout: 10 minutes
- Analyze (powered by AI): Group similar failures and diagnose root causes
- Timeout: 60 minutes
- Summarize: Assemble structured JSON and HTML reports
- Timeout: 5 minutes
- Notify: Create tickets and send alerts
- Timeout: 5 minutes
- Publish: Commit reports to institutional wikis
- Timeout: 5 minutes
Only the Analyze stage uses AI tokens. The other 4 are deterministic.
Initially, our architecture included AI in the Summarize stage, as well. We subsequently removed it. Assembling a report from structured data is fundamentally a templating problem, which traditional templating tools solve perfectly. Every AI token spent on document formatting is a token diverted from reasoning, and this introduces unnecessary non-determinism into outputs that should remain highly predictable
Our guiding principle emerged clearly. We deploy AI where causal reasoning is required, and we rely on code where structure suffices.
Signal extraction: Preparing the logs
Raw CI trace logs are notoriously noisy. They are filled with ANSI color codes, timestamped section markers, and progress bars that terminals render elegantly but logs capture as hundreds of redundant states. The actual error is often buried deep within this output.
[2026-08-24T03:14:22.001Z] section_start:1724472862:build_wheels\r\033[0K
\033[36;1mCollecting torch==2.1.0\033[0m
  Downloading torch-2.1.0 ██░░░░░░░░░ 12%\r  Downloading torch-2.1.0 ████░░░░░░░ 35%\r  Downloading torch-2.1.0 ██████░░░░░ 58%\r  Downloading torch-2.1.0 ████████░░░ 82%\r  Downloading torch-2.1.0 ██████████ 100%
...
(10,000 more lines)
...
ERROR: Job failed: exit code 1
PFA's Prepare stage strips away this noise deterministically. The progress bar cleanup, for example, is just 3 lines of Python eliminating hundreds of extraneous lines from each log:
cr_cleaned: list[str] = []
for line in lines:
    line = line.rstrip("\r")
    if "\r" in line:
        line = line.split("\r")[-1]
    cr_cleaned.append(line)
After cleaning, a 2-tiered error extraction process identifies critical signals:
- Built-in patterns (13 regexes): Capture standard Python tracebacks, non-zero exit codes, compiler faults, OOM kills, and disk exhaustion
- Domain-specific patterns (9 regexes): Loaded externally to catch project-specific failure modes
Each match acts as an anchor. PFA captures a specific contextual window of 50 lines prior and 20 lines after the match, merges overlapping windows, and deduplicates the output. A 10,000-line trace is reliably condensed to a footprint of 200 to 500 lines. That is a 95-98% compression ratio with virtually 0 signal loss.
A practical fallback exists for edge cases: CI platforms predictably append ERROR: Job failed: exit code 1 at the end of failing jobs. If that is the only pattern matched, then PFA falls back to the last 200 lines instead, which usually contain the actual failure.
Furthermore, a grammar-aware parser deterministically breaks down CI job names into structured metadata like hardware target, OS, and architecture. This parsing provides the AI with precise context rather than unstructured strings.
The semantic gap: Where AI earns its keep
Traditional failure clustering uses edit distance or token overlap on error messages. For most CI systems, this works well enough. But it falls apart in multi-architecture builds, and this is where the AI earns its place.
Consider a missing Python wheel. On an x86_64 build, the system reports a specific error:
Could not find a version that satisfies the requirement torch==2.1.0However, the exact same missing dependency on an aarch64 build triggers a wildly different stack trace:
subprocess.CalledProcessError: Command ['cmake', ...] returned non-zero exit status 1A human engineer intuitively connects these 2 logs. Traditional string-based algorithms cannot make this connection because there is effectively no text overlap.
This is the exact problem PFA's Analyze stage solves. By utilizing the agentic-ci framework, an LLM agent semantically groups the cleaned error extracts by root cause. This step successfully bridges the gap across different platforms and hardware.
Consider this example output:
✘ build-cuda12.8-ubi9-x86_64    ✘ build-cuda12.6-ubi9-x86_64
✘ build-cpu-ubi9-x86_64         ✘ build-rocm6.3-ubi9-x86_64
✘ build-cuda12.8-ubi9-aarch64   ✘ build-cuda12.6-ubi9-aarch64
✘ build-cpu-ubi9-aarch64        ✘ publish-cuda12.8-ubi9
✘ publish-cuda12.6-ubi9         ✘ release-cuda12.8-ubi9
... 40+ more
What used to be a flat list of 52 isolated failures is now consolidated into manageable insights:
| Group | Root cause | Jobs | Action |
|---|---|---|---|
| 1. PyTorch version conflict | PyTorch version conflict due to broken CUDA pinning | 32 | Ticket created, fix suggested |
| 2. Network timeout (transient) | Transient network timeout from an upstream mirror | 12 | Auto-skipped, no ticket |
| 3. Missing dependency | Missing dependency dropped from the index | 8 | Ticket created, target repo identified |
Once grouped, a secondary AI skill investigates the root cause while being heavily augmented by context. It reviews the group metadata, the pipeline's Git ref, and dynamically cloned source repositories pointing to the exact failing commit.
Trust requires rigorous validation
How do you trust AI output in a mission-critical automated pipeline? You don't trust it outright. Instead, you validate it meticulously. PFA enforces 5 strict validation layers before any AI findings proceed downstream:
1. Verdict
- Validation scope: Per finding
- Enforcement criteria: 13 required fields, enum membership
2. Findings gate
- Validation scope: Per group
- Enforcement criteria: Section file presence, cross-references
3. Path audit
- Validation scope: Per reference
- Enforcement criteria: Canonical path format, no directory refs
4. Schema
- Validation scope: Full summary
- Enforcement criteria: JSON Schema validation, cross-field checks
5. Trace
- Validation scope: Per job
- Enforcement criteria: Minimum size, no HTML/JSON error responses
The last layer (Trace) catches a subtle failure mode. If a CI API returns an HTML error page instead of a proper log, an unvalidated AI would confidently analyze the HTML markup and hallucinate an entirely fabricated diagnosis.
stripped = first_line.lstrip()
if stripped.startswith("<!") or stripped.startswith("<html"):
    return "HTML content (API error page)"
When the model fails due to hallucination, timeout, or schema violation, the system is designed to degrade gracefully. It defaults to creating a catch-all group containing every failed job. The team still receives a notification, and a fallback ticket is still filed. Automation should degrade safely, but it must never silently drop a failure.
Confidence as a spectrum, not a threshold
Automation is most effective when it is treated as a spectrum rather than a binary switch. When creating tickets for failures, PFA calibrates its actions based on the AI's confidence level regarding duplicates:
def decide_action(dedup_result):
    if not dedup_result or not dedup_result.get("match_found"):
        return "create", None

    confidence = dedup_result.get("confidence", "low")
    ticket = dedup_result.get("ticket", {})

    if confidence == "high":
        return "comment", ticket
    if confidence == "medium":
        return "create_with_note", ticket
    return "create", None
High confidence appends a comment to an existing ticket, while medium confidence creates a new ticket but flags it for manual review. Low confidence assumes a novel issue. Additionally, PFA identifies cascade groups resulting from downstream side-effects and transient groups caused by flakes. It purposefully skips ticket creation for these cases to drastically reduce developer noise.
Continuous learning engine
A single tool solves a problem once, while a well-designed system improves over time. PFA is the sensory component in a 3-repository, self-healing ecosystem, as illustrated in figure 1.
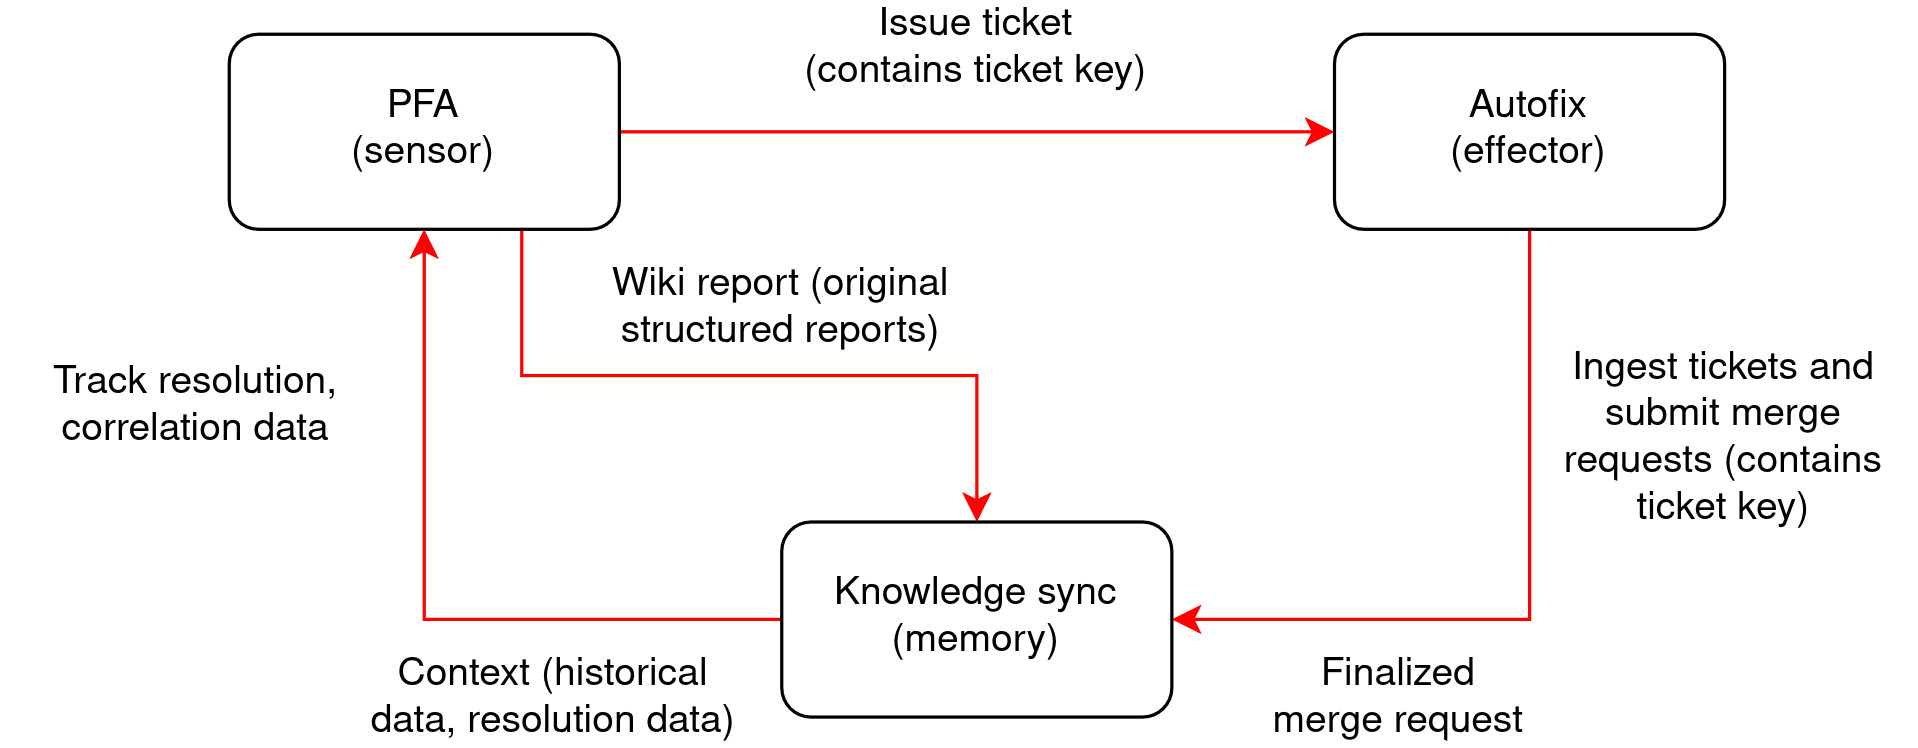
- PFA (sensor): Analyzes failures, publishes structured reports, and creates tickets
- Autofix (effector): Ingests PFA tickets, generates code fixes, and submits merge requests containing the respective ticket keys
- Knowledge sync (memory): Tracks resolution data by correlating accepted merge requests with original tickets to enrich historical reports
When these enriched reports are fed back into PFA's analysis context, the AI gains concrete historical context. It learns that a specific failure pattern was previously resolved by applying an exact fix. The system does not fine-tune model weights. Instead, it keeps the LLM generalized while systematically building highly specific institutional memory.
PFA is not fully autonomous, the system remains subordinate to the engineer. PFA performs the tedious investigative groundwork, but human engineers retain total authority over validation and resolution since merging autofix merge requests is strictly a manual decision.
Operational results and next steps
Deployed in production since June 2026, PFA has fundamentally shifted our workflow.
- Pipeline failures diagnosed: 110
- Issues auto-fixed and merged: 78
- Resolution rate on PFA tickets: 68%
When the pipeline breaks at 2:00 AM, the engineer reviews a proposed merge request at 9:00 AM rather than beginning a forensic investigation from scratch.
- Source code: ~4,800 lines of Python (15 modules)
- Test code: ~4,800 lines (1:1 test-to-source)
- Error patterns: 22 (13 built-in + 9 domain-specific)
- Context windows: 50 lines before, 20 lines after
- Projects tracked: 12
- Ai-powered stages: 1 of 5
The AI skill definitions PFA uses for grouping and root cause analysis are also open source.
Try this on your own CI system
You do not need Pipeline Failure Analyzer (PFA) to get the biggest win from this approach. The Prepare stage accounts for the largest single improvement in analysis quality, and it is 200 lines of Python with no AI dependencies.
Here is a minimal log cleaner you can drop into any CI pipeline. It handles the 3 noise sources that account for 90% of trace log bloat: ANSI escape codes, CI section markers, and progress bars.
import re

ANSI_RE = re.compile(r"\x1b\[[0-9;]*[a-zA-Z]")
SECTION_RE = re.compile(r"section_(start|end):\d+:")

def clean_trace(raw_lines: list[str]) -> list[str]:
    cleaned = []
    for line in raw_lines:
        # Strip ANSI color codes
        line = ANSI_RE.sub("", line)
        # Drop CI section markers (GitLab, GitHub Actions, Jenkins)
        if SECTION_RE.search(line):
            continue
        # Collapse carriage-return progress bars to final state
        line = line.rstrip("\r")
        if "\r" in line:
            line = line.split("\r")[-1]
        if line.strip():
            cleaned.append(line)
    return cleaned
Add your own error patterns on top of this. Start with the failures your team sees most often. 2 or 3 regexes that match Python tracebacks, non-zero exit codes, and OOM messages catch the majority of real errors in most CI systems:
ERROR_PATTERNS = [
    re.compile(r"Traceback \(most recent call last\)"),
    re.compile(r"exit (code|status) [1-9]"),
    re.compile(r"Out of memory|OOM|Cannot allocate memory"),
]

def extract_errors(lines: list[str], before=50, after=20) -> list[str]:
    anchors = []
    for i, line in enumerate(lines):
        if any(p.search(line) for p in ERROR_PATTERNS):
            anchors.append((max(0, i - before), min(len(lines), i + after)))
    # Merge overlapping windows
    merged = []
    for start, end in sorted(anchors):
        if merged and start <= merged[-1][1]:
            merged[-1] = (merged[-1][0], max(merged[-1][1], end))
        else:
            merged.append((start, end))
    return [lines[i] for s, e in merged for i in range(s, e)]
That's the core of PFA's Prepare stage, stripped to the essentials. A 10,000-line trace becomes a few hundred lines of signal. You can pipe the output into any analysis tool, an LLM, or even just grep.
The key insight: Invest in preprocessing before you invest in AI. Clean input to a simple model beats noisy input to a powerful one.
Design principles
Here are some important lessons we've learned to integrate into our design decisions.
Draw a strict AI boundary
This sounds obvious. It is not. The temptation is to let the AI handle everything. But non-determinism should be confined to stages where it provides value. Everything else should be deterministic and testable with conventional methods.
Preprocess aggressively
The Prepare stage accounts for the largest single improvement in analysis quality. Clean input matters more than prompt engineering. A log cleaner tailored to your CI system's noise patterns is straightforward to build and pays for itself immediately.
When the AI returns a finding.json, PFA checks 13 required fields, validates enum values, verifies section file cross-references, runs a JSON schema pass on the full summary, and checks that trace logs are not HTML error pages. That's 5 layers of validation on what is, from the perspective of every downstream stage, untrusted input. Schema validation alone does not catch a hallucinated file path or a confidence value of "pretty sure".
Map confidence to behavior
Different confidence levels should trigger different actions. PFA's 3-tier de-duplication system (comment, create-with-warning, create) applies wherever AI judgment drives automated actions. The same applies to degradation: When AI grouping fails, create a catch-all group. When ticket creation fails, file a fallback. When the full analysis fails, send a fallback notification. No single failure should prevent the team from learning about pipeline failures.
Build the feedback loop at the start. It's harder to retrofit it than to build alongside the initial system. Even if you start by just publishing structured reports to a predictable location, you are creating the foundation for a learning system. The reports accumulate. The enrichment pipeline discovers patterns no individual analysis would surface. The loop compounds value over time in a way that a standalone tool cannot.
Where to start
If you're staring at a CI dashboard full of red and wondering whether any of this applies to your system, here is a concrete path:
- Today: Copy the log cleaner from the section above. Run it on your noisiest failing job. If the compression ratio is above 90%, then your traces have the same noise problem ours did, and the fix is 30 lines of Python.
- This sprint: Add error pattern extraction. Start with 3 patterns that match your most common failure modes. Write them down before you look at the logs. The patterns you can name from memory are the ones worth automating first.
- When you're ready for AI: Feed the cleaned, extracted errors into any LLM with a structured output schema. Ask it to group failures by root cause. Validate the output with a JSON schema before anything downstream touches it. The validation layer is not optional.
All 3 repositories linked throughout this post (PFA, agentic-ci, pipeline-skills) are open source. If your CI system generates trace logs, the architecture applies. The job names and error patterns change. The 5-stage structure does not. Open an issue on any of these repos if you want to talk about adapting this for your stack.

