"What did AI cost us this quarter?" That question lands in every platform team's lap eventually, and most teams can't answer it. The CFO isn't trying to be difficult when they ask, but they do need a number, broken down by department, and they need it before the next board meeting.
Here's what makes it so hard: 3 departments share a GPU cluster. Engineering is running code reviews through a 27-billion-parameter model every 5 seconds. Marketing generates campaign copy on the same model every 12 seconds. Support handles quick customer questions on a smaller, cheaper model every 20 seconds. All of that traffic flows through the same infrastructure, and the bill arrives as a lump sum assigned to the platform team.
Suppose the total is $14,200 for the quarter, but nobody knows who spent what. Engineering might be responsible for $9,000 of that, or $5,000, or who knows. The platform team ends up playing detective with spreadsheets and chat messages, and the answer takes 2 weeks if it comes at all.
We built a working demo on Red Hat OpenShift AI that answers that question in under a minute, and I want to walk through how it works and why it matters more than you might think.
What happens when nobody knows the breakdown
When AI costs show up as a single line item, nobody has a reason to be efficient because there's no feedback loop connecting a team's usage to the cost they're generating. It's like splitting the dinner check evenly at a table of 12, where the person who ordered the expensive lobster has no incentive to order differently next time.
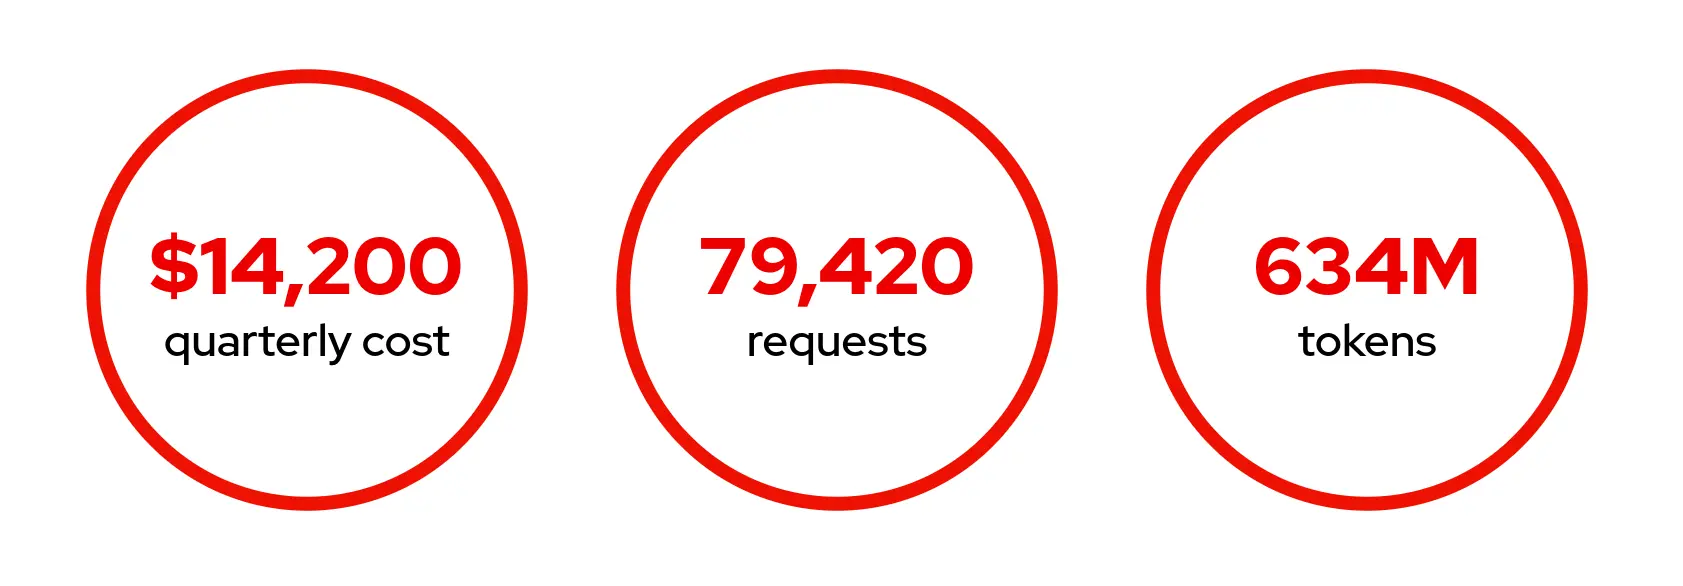
In our OpenShift AI demo, marketing was the department ordering the lobster, and we only caught them because of per-department metrics. While the 3 departments combined to generate 79,420 inference requests and consumed 634 million tokens over a quarter, the truly critical number is hiding underneath: Marketing was running at just 32% GPU utilization, which means 68% of their allocated GPU capacity sat idle the entire time. At $50,000 per GPU node per year, that's roughly $34,000 in annual waste that nobody would catch without per-department metrics. And without showback, nobody even knows to ask the question.
This isn't about control
Whenever I talk about showback at conferences or in demos, the first reaction is almost always some version of, "So you want to monitor and control what teams are doing." I understand why that's the instinct, but it's entirely wrong. It misses the most important truth about cost attribution.
Imagine you're scanning your showback dashboard and you notice that HR has generated 80% of your cluster's token consumption for 3 months straight. That seems impossibly high for their workload, so you sit down with them to investigate.
As it turns out, the default model they were assigned wasn't very good for their specific use case. To get a useful answer, their users had to constantly reprompt, refine and retry, and all that repetitive reprompting was silently burning through their token allocation.
To solve the problem, you simply grant them access to the higher-quality models that Engineering is already using. Instantly their token consumption drops because they're getting accurate answers on the 1st try instead of the 5th. Their daily experience gets better, your cluster costs go down, and you would have never known they were struggling without showback data surfacing the bottleneck.
That isn't surveillance. That's the platform team discovering a department was struggling silently and helping them solve it. Every time I tell that story in a room full of FinOps people, you can see the moment it clicks.
Showback finds problems people didn't even know they had and gives platform teams the visibility to actually solve them. The HR team was never going to file a ticket that their models weren't good enough because they didn't know that was the bottleneck. The metrics told a completely different story.
How the observability stack works
So how do you actually build this? The cost attribution system components are available in Red Hat OpenShift AI 3.4 and later, and each one answers a specific question from the story above.
Models-as-a-Service (MaaS)
The MaaS gateway is the front door. It sits in front of your model servers, and each department gets its own API key created in the OpenShift AI dashboard under gen AI studio. The gateway routes requests by model and authenticates them by key, establishing the identity boundary for everything that follows. This is how you know who exactly calls what.
vLLM and llm-d
vLLM or llm-d serve the models behind the gateway. In our demo, we run a primary model (gemma4) shared by Engineering and Marketing, and a secondary model (qwen35-9b) for Support. The serving layer automatically reports token counts per request back to Prometheus, which is the source of truth for our raw usage data.
Prometheus and cluster observability
Prometheus, through the cluster observability operator (COO), auto-scrapes token consumption metrics without requiring sidecar injection, custom exporters, or additional configuration. When you deploy a model through MaaS, Prometheus starts collecting per-user, per-model token metrics automatically, leaving no instrumentation work for the platform team.
Perses dashboards
The built-in Perses dashboards visualize data directly in both the OpenShift Console (in Observe > Dashboards > Usage) and the OpenShift AI console in Observe and Monitor. You can install them in either console depending on where your teams already work. This is the same usage dashboard introduced in OpenShift AI 3.4 that provides per-subscription and per-model token tracking. You can filter by subscription (which maps to a department's API key) to isolate a single department, or filter by model to see the cost differences between workloads. This high-level view is exactly where you can spot the signs of a team struggling, such as the HR re-prompting pattern discussed earlier.
While Perses gives you the macro-level view, MLflow provides the detail by tracing every inference request at the application level. Each transaction trace captures the department name, the prompt (truncated for privacy), the model used, precise input and output token counts, latency, and the calculated cost of that specific call. If the Perses dashboard tells you that "Engineering spent $9,000 this quarter," MLflow lets you drill down and see that $4,200 of that went to automated code reviews and $2,800 went to unit test generation.
What a trace looks like
Each request creates a 2-span trace: A parent AGENT span with the department name and prompt, and a child CHAT_MODEL span with the model details, token counts, latency, and cost.
AGENT span: engineering_agent├── input: "Review this Go module for concurrency issues..."├── department: engineering└── CHAT_MODEL span: generate_response ├── model: gemma4 ├── input_tokens: 487 ├── output_tokens: 312 ├── cost: $0.02143 └── latency: 2.4sThis means you can answer not just "How much did engineering spend?" but "What were they spending it on?" and whether that spending pattern makes sense for the value they're getting.
The cost model
You need a way to turn raw token counts into actionable dollar amounts. The good news is that you define what a token costs and the platform automatically handles the rest. The MaaS gateway API key system gives you clear, per-department identity boundaries, while MaaS subscriptions enforce token quotas per team. With these boundaries established, you just need to assign the rates. In our demo, we define per-model pricing as the cost per 1,000 tokens, split precisely between input and output:
gemma4 (primary)
- Input cost per 1K tokens: $0.015
- Output cost per 1K tokens: $0.045
qwen35-9b (secondary)
- Input cost per 1K tokens: $0.005
- Output cost per 1K tokens: $0.015
The cost calculation itself is just a few lines:
COST_PER_1K = { "gemma4": {"input": 0.015, "output": 0.045}, "qwen35-9b": {"input": 0.005, "output": 0.015},}def calculate_cost(model, input_tokens, output_tokens): rates = COST_PER_1K.get(model, {"input": 0.01, "output": 0.03}) return (input_tokens / 1000 * rates["input"]) + \ (output_tokens / 1000 * rates["output"])The input/output split matters because different workloads have very different token profiles. For example, Engineering sends long code context as input and gets detailed analysis as output, so both sides are token-heavy. Conversely, Support uses short customer questions and short answers on a cheaper model that costs 3x less per token than our primary model (gemma4). That cost difference is completely lost if you're only tracking total tokens, and it's the kind of granularity that makes the difference between an accurate billing-grade showback report and a misleading one.
From dashboards to board reports
Once all of this is flowing, the aggregated usage metrics map directly to the kind of insights a VP of Finance actually wants to see. Here's what our completed demo's quarterly breakdown looks like:
Engineering (60%)
- Spend: $9,120
- Notes: GPU utilization at 78%, healthy with no changes needed
Marketing (25%)
- Spend: $3,550
- Notes: GPU utilization at 32%, overallocated and should be right-sized
Support (15%)
- Spend: $1,530
- Notes: GPU utilization at 45%, right-sized for burst workloads on a cheaper model
The action items become obvious when you see the numbers laid out like this. Engineering is spending the most but also getting the most utilization out of their allocation, so their spend is highly efficient. Marketing is overallocated on GPU capacity and should be right-sized to eliminate that $34,000 in waste, which frees up valuable GPU capacity for other teams. And Support made a smart decision using the smaller model (qwen35-9b) for their workload since their queries don't need a 27B parameter model (gemma4) to answer accurately.
This is exactly the kind of conversation you want to be having with Finance. Instead of presenting a lump-sum bill of $14,200 with a shrug, you're saying "Here's what each team spent, here's which allocations make sense, and here's where we can save money." That's a much better meeting between the platform team and the business.
Common objections
Implementing a new system always generates questions. Here are a few common questions, along with realistic answers.
"Is this hard to set up?"
The demo runs in about 5 minutes. You clone the repo, set your environment variables, and run the load generator. If you already have OpenShift AI 3.4 with MaaS Gateway deployed, then the observability pieces are already collecting data. You're mostly just visualizing what's already there.
"Do we need a separate billing tool?"
No, and that's one of the things that surprised us when we built this. The platform already collects the data through Prometheus and the MaaS Gateway. The Perses usage dashboard is built into OpenShift AI 3.4. MLflow adds the application-level traces. You don't need to buy or integrate a third-party billing system to get started with showback.
Cost attribution doesn't require changes to application code. If a team is already calling the MaaS Gateway with an API key, their usage is being tracked. The data is already there.
"Will teams feel surveilled?"
This is the most common concern, and the HR reprompting story is the best answer I've found. Showback found a problem that HR didn't know they had, and the fix made their experience better while reducing costs at the same time. When you frame cost attribution as "we're trying to make sure every team has access to the right models and isn't struggling unnecessarily," it lands very differently than "we're watching what you spend." The data is there to help, not to police.
Get started
The demo runs on OpenShift AI 3.4 or later. Clone the demo-chargeback repository, configure your environment, and generate traffic:
cp .env.example .envEdit the .env to set the MAAS_GATEWAY, API keys, and the MLflow URI.
python generate-load.py --duration 5Within 5 minutes, your Perses and MLflow dashboards show per-department cost attribution data. The repository includes prompt sets for all 3 departments, on-cluster deployment with a Kubernetes Job, and a presenter walkthrough for live demos.
Try it yourself
The next time someone asks "what did AI cost us this quarter," you should be able to answer with a dashboard, not a spreadsheet. The demo-chargeback repository gives you a working starting point that runs from a laptop or on your cluster, and the OpenShift AI documentation covers everything you need for a production deployment.
This blog post builds a working cost attribution system on top of MaaS. Use these resources to learn more about the underlying platform capabilities and the broader context for why per-department AI cost tracking matters:
- Track model usage with the OpenShift AI 3.4 usage dashboard: Detailed walkthrough of the built-in showback dashboard, including its current capabilities, cardinality considerations, and the roadmap for log-based metering.
- API Keys: How applications get the same governed access as people: The API key lifecycle that makes per-department cost isolation possible: scoped keys bound to subscriptions with individual tracking and instant revocation.
- Total Economic Impact of Red Hat OpenShift AI: Download the report

