Starting with Red Hat OpenShift 4.21, Linux pressure stall information (PSI) can be enabled using a MachineConfig object. Enabling PSI monitoring makes PSI metrics for CPU, memory, and I/O available for your cluster. Activating PSI helps you monitor and act on actual resource contention, not just utilization.
Traditional metrics (CPU, memory used) tell you how much is being used, but not how much work is being delayed or stalled. To bridge that gap, PSI can:
- reveal hidden bottlenecks before they turn into outages
- explain resource contention that utilization alone can't justify
- support better resource sizing and autoscaling decisions
- improve debugging of resource starvation
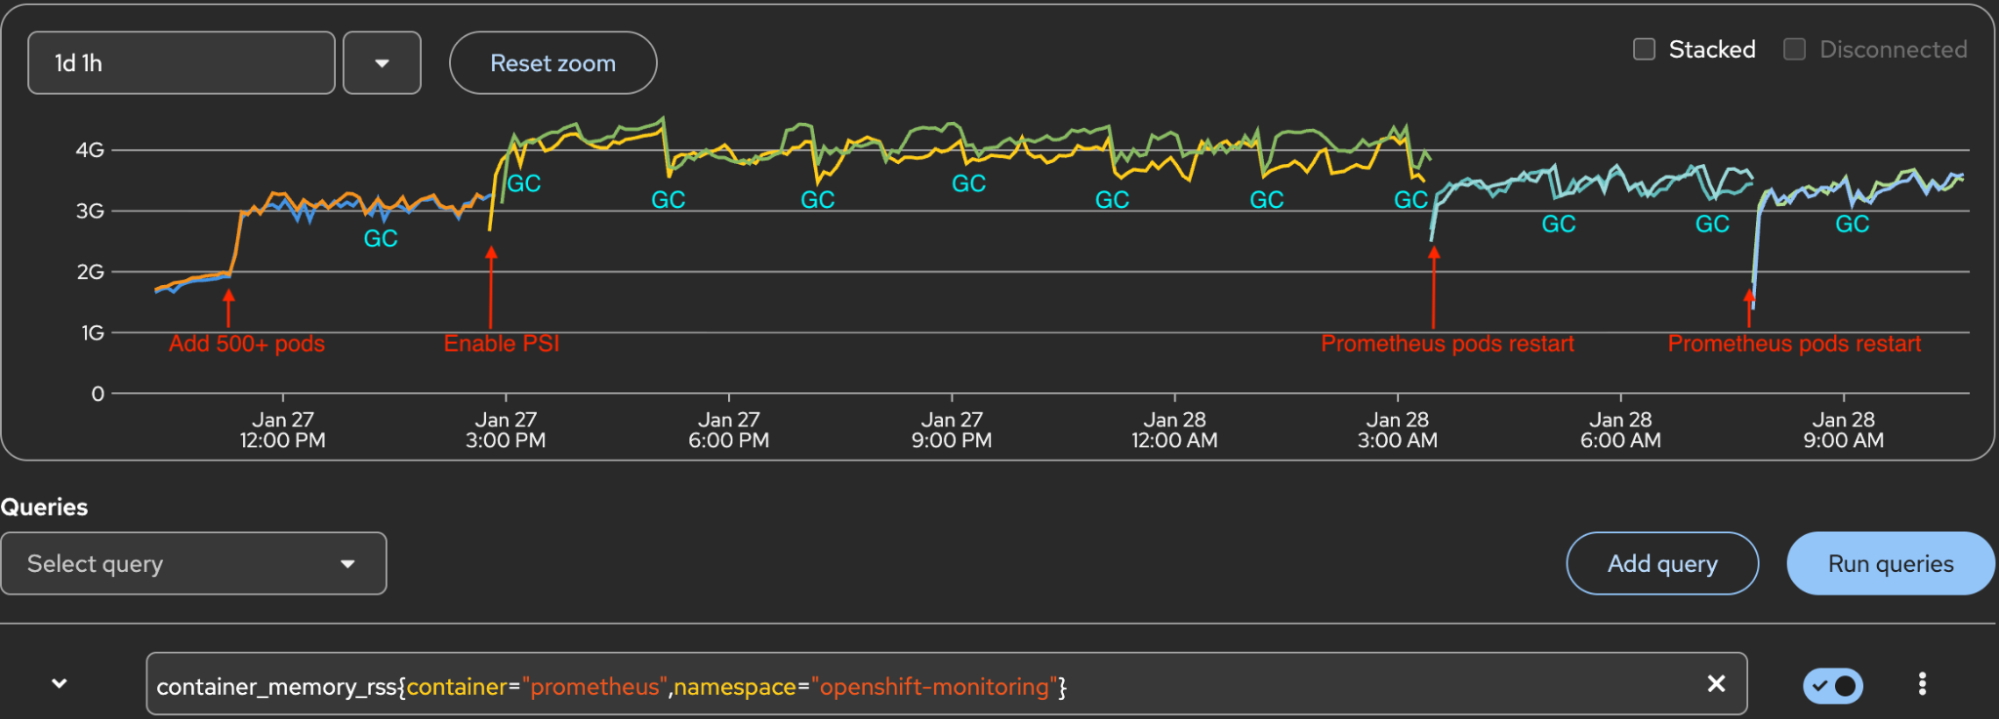
This article shares performance evaluation results for enabling PSI at scale. Enabling PSI has no observable impact on kubelet CPU or memory usage, but with PSI metrics collected at the node, pod, and container level, it does increase memory for Prometheus pods, and the impact grows with large container counts. On a cluster with 500+ test containers, enabling PSI causes Prometheus pod resident set size (RSS) to increase up to 1.3+ GB per Prometheus pod. That's a 42% increase from baseline memory consumption. Understanding the impact helps to plan cluster infrastructure resources before enabling PSI in production.
Vocabulary for PSI
There are two important terms when looking at PSI. First is PSI itself.
- PSI: Pressure stall information is a Linux kernel feature that tracks the time that any process spends waiting for CPU, memory, and I/O resources. There are two levels in PSI: System-wide PSI and per-cgroup PSI.
- System-wide PSI: Exposed in
/proc/pressure/{cpu,memory,io}and represents the global pressure outside of any cgroup. - Per-cgroup PSI: PSI is also tracked for tasks grouped into cgroups. Each subdirectory in the
cgroupfsmountpoint containscpu.pressure,memory.pressure, andio.pressurefiles.
This article focuses on per-cgroup PSI.
- PSI metrics: Kubernetes supports kubelet configuration to collect Linux kernel PSI for CPU, memory, and I/O usage. The information is collected at the node, pod, and container level, and is exposed at the
/metrics/cadvisorendpoint: container_pressure_cpu_stalled_seconds_totalcontainer_pressure_cpu_waiting_seconds_totalcontainer_pressure_memory_stalled_seconds_totalcontainer_pressure_memory_waiting_seconds_totalcontainer_pressure_io_stalled_seconds_totalcontainer_pressure_io_waiting_seconds_total
Test Methodology
We tested the performance impact of enabling PSI on kubelet and Prometheus at a scale, with 500+ user containers in a cluster.
Cluster configuration
- Infrastructure:
- 3 masters nodes
- 3 worker nodes
- 3 infra nodes
- Nodes are AWS EC2 instances with 4 vCPU, 16GB memory
- Component Isolation:
- Ingress, monitoring, and registry components deployed exclusively to infrastructure nodes
- Prometheus configured with persistent storage (PVC-backed)
Test procedure
Here's how we implemented the test.
- Deploy a fresh cluster and allow stabilization for 1 hour.
- Deploy 500+ test pods/containers across worker nodes.
- Monitor cluster for 1-2 hours to establish baseline.
- Enable PSI.
- The MachineConfig adds the boot parameter to set PSI at the kernel level
- After PSI is enabled,
/proc/pressure/{cpu,memory,io}directories are created
- Monitor the cluster for several hours. Compact, GC, and WAL checkpoints happen every 2 hours. They impact the Prometheus RSS. If there are Prometheus pods restarts, this could be caused by nodes updated by an operator, or admin operation. This also impacts Prometheus memory RSS.
- Collect metrics (listed below) in each phase.
Metrics monitored
Here are the metric categories and associated PromQL queries for each:
Pods/container count
sum(kube_pod_status_phase{})by(phase)
count(kube_pod_container_info)
PSI metric count
count({__name__=~"container_pressure_.*"})Prometheus memory RSS
There are two possible queries to retrieve this information:
container_memory_rss{container="prometheus",namespace="openshift-monitoring"}

container_memory_working_set_bytes{container="prometheus",namespace="openshift-monitoring"}
Kubelet process CPU
irate(process_cpu_seconds_total{service="kubelet",job="kubelet"}[1m])*100 * on (node) group_left kube_node_role{ role = "worker" }Kubelet process memory
process_resident_memory_bytes{service="kubelet",job="kubelet"} * on (node) group_left kube_node_role{ role = "worker" }Kubelet slice CPU
rate(container_cpu_usage_seconds_total{ job=~".*", id =~"/system.slice/kubelet.service"}[1m]) * 100* on (node) group_left kube_node_role{ role = "worker" }Kubelet slice memory
container_memory_rss{ job=~".*", id =~"/system.slice/kubelet.service"} * on (node) group_left kube_node_role{ role = "worker" }Test results
Our tests produced the results displayed in the following table:
| Metrics | Phase1 After install | Phase2 Add 500+ pods (Baseline) | Phase3 Enable PSI | Phase4 After compact/GC | Phase5 After prometheus pods restart |
|---|---|---|---|---|---|
| Prometheus RSS(0/1) | 1.887G/1.956G | 3.102G/3.098G (Phase1+1.215G/1.142G) | 4.414G/4.251G (Baseline+1.312G/1.153G) | 3.827G/3.756G (Baseline+725M/658M) (Phase3-587M/495M) | 3.361G/3.314G (Baseline+259M/216M) (Phase4-466M/442M) |
| Containers | 587 | 1131 (Phase1+544) | 1126 (Baseline-5) | 1126 | 1149 (Phase4+23) |
| Running pods | 279 | 823 (Phase1+544) | 823 | 823 | 823 |
| PSI metrics | 11,448 | 24,504 (Phase1+13,056) | 24,504 | 24,504 | 24,504 |
| PSI container metrics from nodes cadvisor | 11,556 | 24,612 (Phase1+13,056) | 24612 | 24612 | 24612 |
| Total metrics | 484,597 | 691,997 (Phase1+207,400) | 699,697 (Baseline+7,700) | 699,976 (Phase3+279) | 611,389 (Phase4-88,587) |
Prometheus memory impact
Based on these test results, we found that with 500+ test pods, the maximum Prometheus RSS increase per pod can exceed 1.3 GB.
- Baseline (deployed 500+ test pods): Established baseline memory usage of 3.0-3.1GB.
- PSI enabled: 1.2-1.3 GB RSS increase per Prometheus pod.
- After compaction/GC/WAL checkpoint: 400-500 MB RSS decrease per pod, but usage increased again until the next compaction cycle.
- Prometheus pods restart: 400+ MB RSS decrease per pod. Compared to baseline, there is a 200-300MB increase.
RSS is the physical RAM a process is actually using. You can see the Prometheus memory RSS increase in Figure 1.
Kubelet CPU and memory
There's no significant increase in kubelet CPU or memory after enabling PSI. This was validated for both kubelet process metrics and kubelet systemd slice metrics.
Figure 2 displays the kubelet process CPU. The yellow line at the top is the sum of 3 workers. Lines below the top line are for each worker. The Y-axis 100 marker is 1 core of CPU.
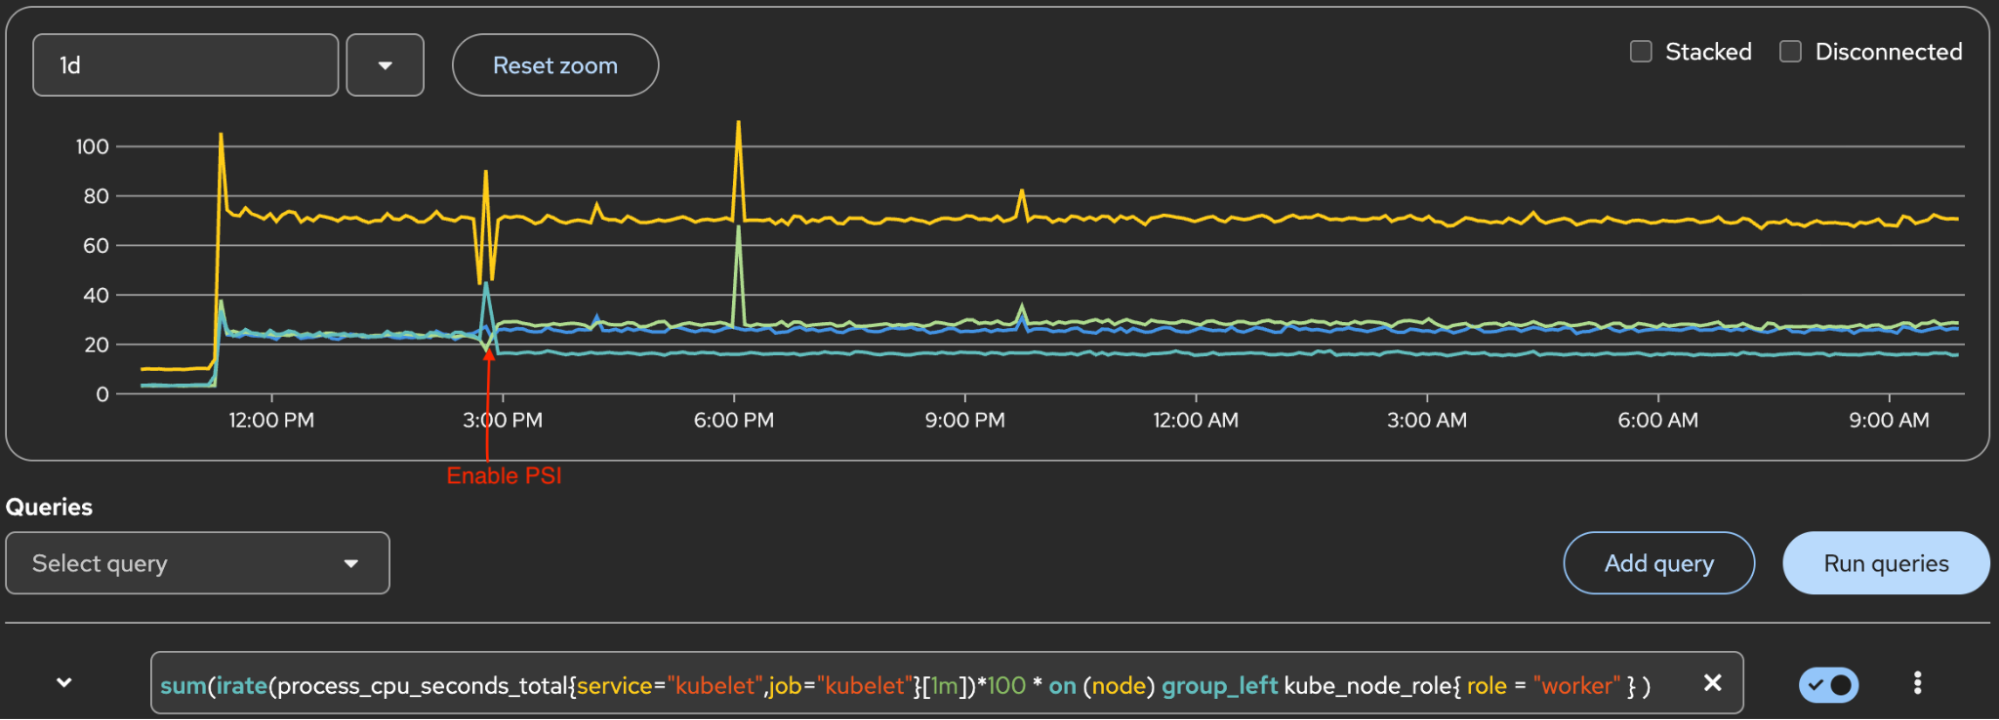
Figure 3 displays kubelet process memory. The yellow line at the top is the sum of 3 workers. Lines below it are for each worker.
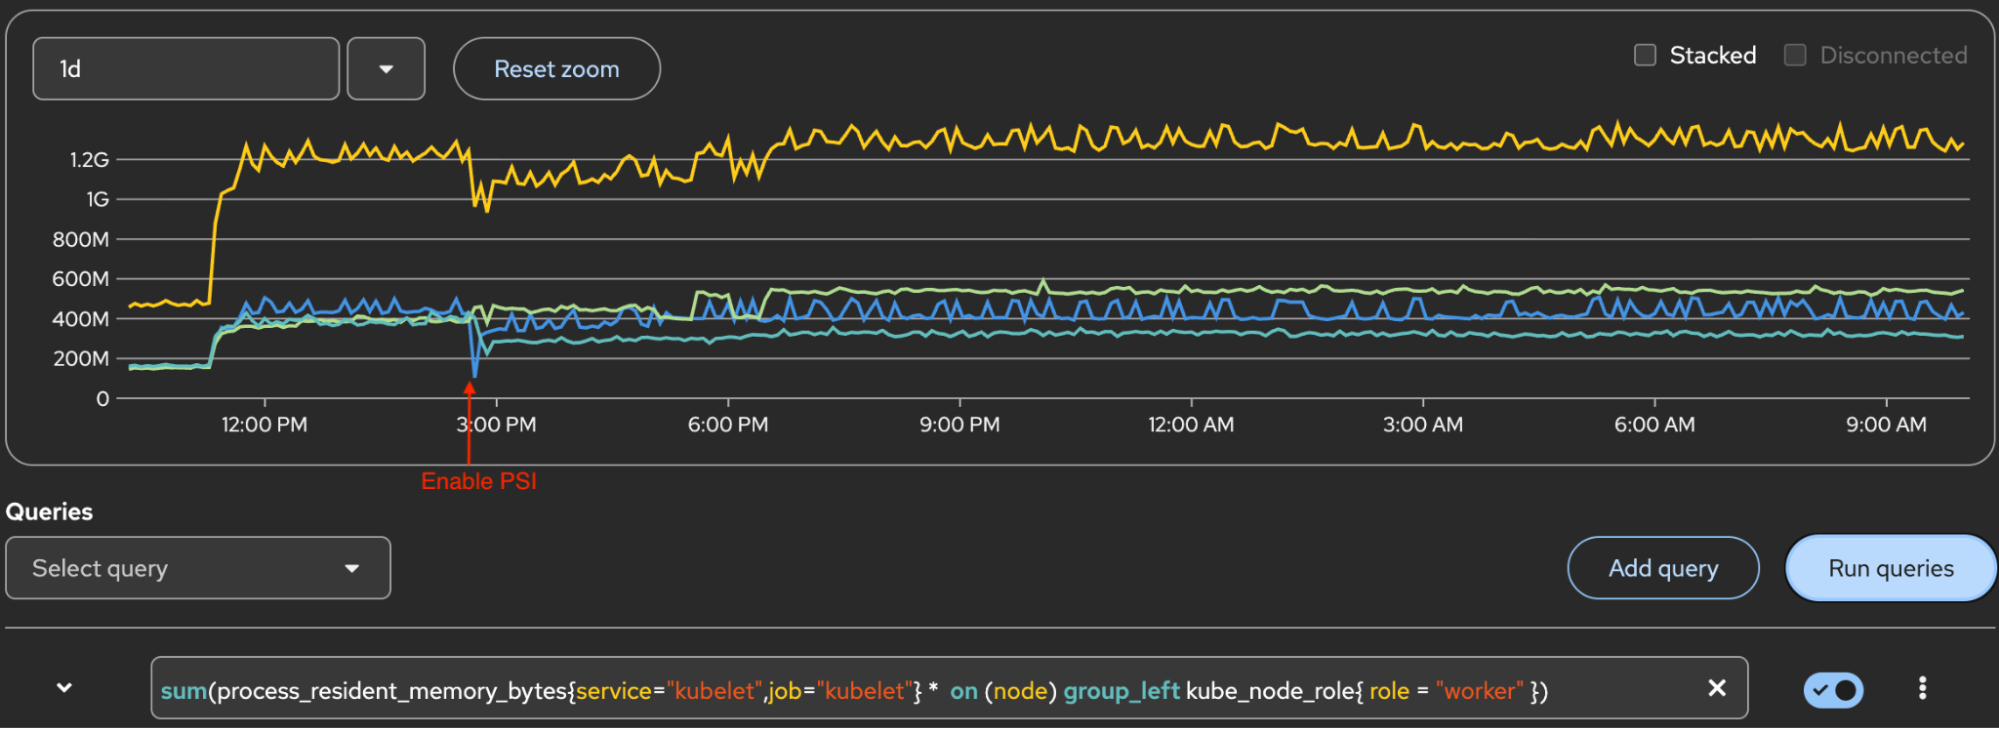
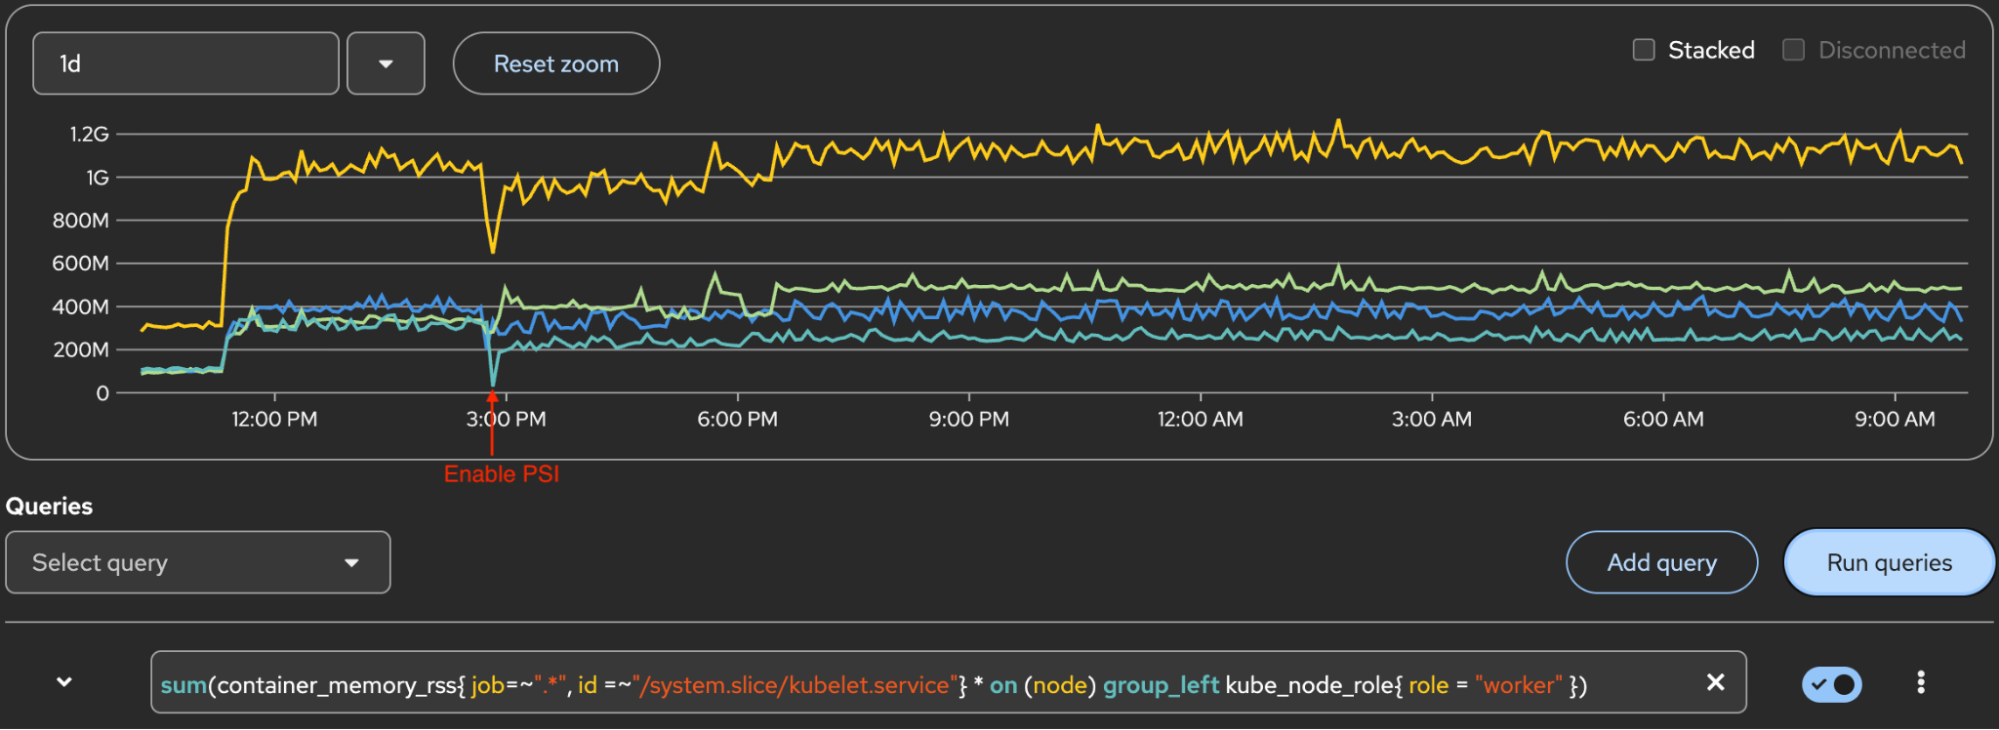
Figure 4 displays the system.slice/kubelet.service CPU. The Y-axis 100 marker is 1 core of CPU. The yellow line at the top is the sum of 3 workers, and lines below it are for each worker.
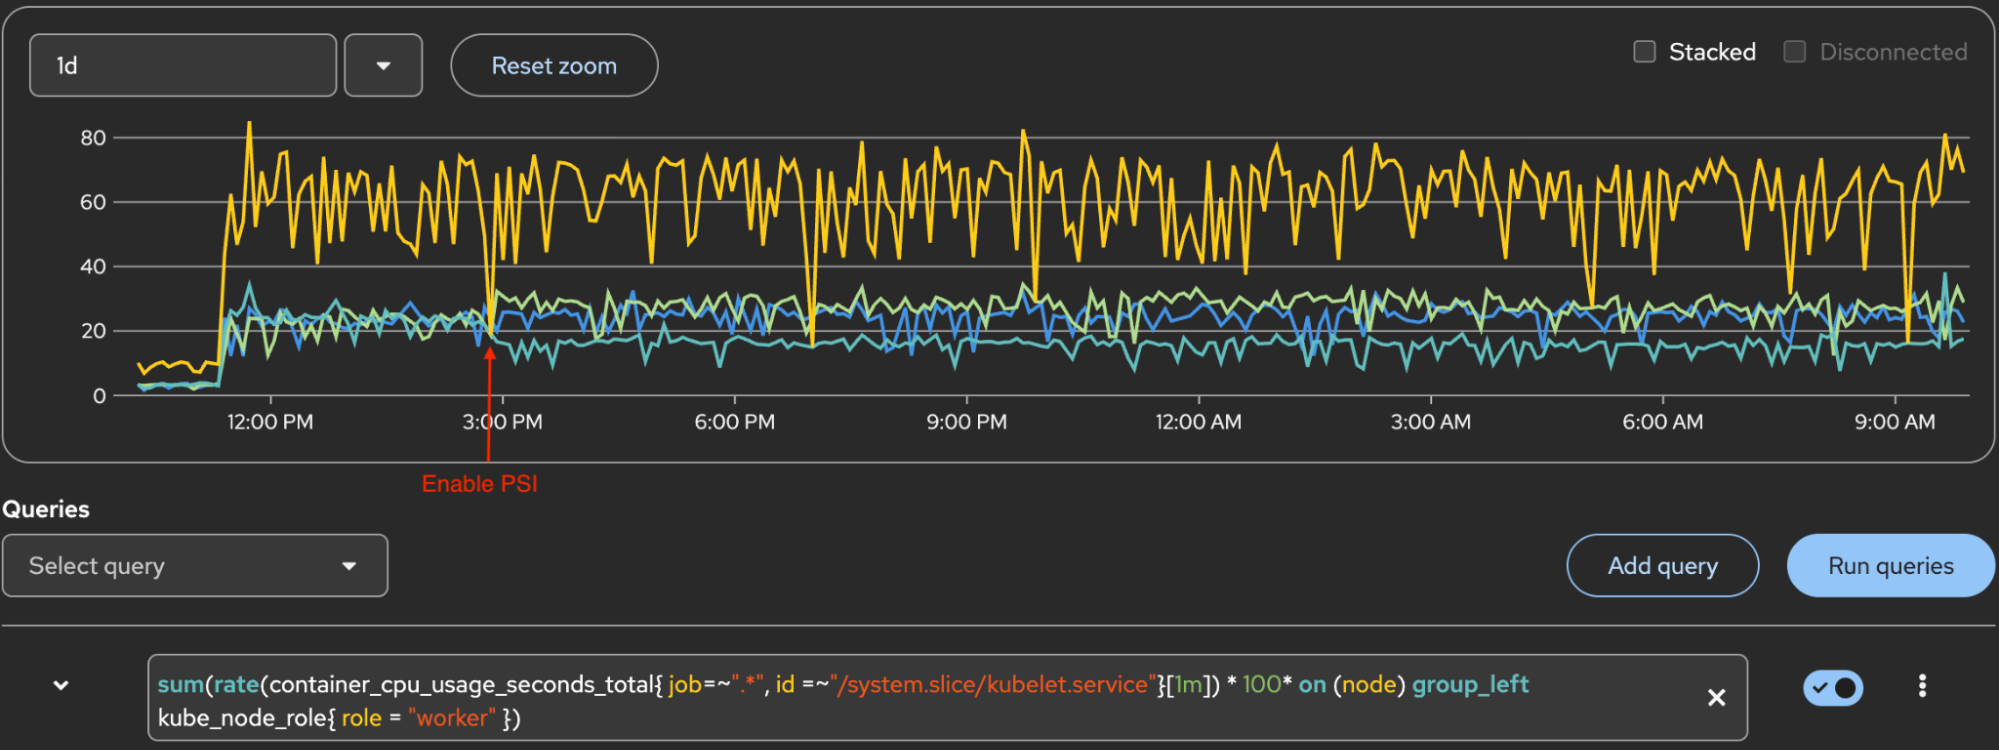
Figure 5 displays system.slice/kubelet.service memory. The yellow line at the top is the sum of 3 workers. Lines below are for each worker.
Understanding PSI metric cardinality
For each pod, PSI metrics are emitted not only for application containers but also for two additional containers:
- container="" (pause container - infra)
- container="POD" (pod cgroup)
Here is an example of one of three PSI metrics for a pod:
container_pressure_cpu_waiting_seconds_total{container="",id="/kubepods.slice/kubepods-burstable.slice/kubepods-burstable-pod43e94c3b_60b2_463c_bb0c_bb10d153e49d.slice",image="",name="",namespace="node-density-heavy-0",pod="perfapp-1-1-bc966c69-h6c77"} 1.456709 1769503672619

container_pressure_cpu_waiting_seconds_total{container="POD",id="/kubepods.slice/kubepods-burstable.slice/kubepods-burstable-pod43e94c3b_60b2_463c_bb0c_bb10d153e49d.slice/crio-d9ee10c5cdfc43b2bf36c7af5e34cffd4c353e09de52556c06ab98ee25d89310",image="",name="k8s_POD_perfapp-1-1-bc966c69-h6c77_node-density-heavy-0_43e94c3b-60b2-463c-bb0c-bb10d153e49d_0",namespace="node-density-heavy-0",pod="perfapp-1-1-bc966c69-h6c77"} 0 1769503667734

container_pressure_cpu_waiting_seconds_total{container="perfapp",id="/kubepods.slice/kubepods-burstable.slice/kubepods-burstable-pod43e94c3b_60b2_463c_bb0c_bb10d153e49d.slice/crio-cf24cfb805081bc45e300e9c041d123b78bc97167e43831d83bb1b1c1bfd7609.scope",image="quay.io/cloud-bulldozer/perfapp:latest",name="k8s_perfapp_perfapp-1-1-bc966c69-h6c77_node-density-heavy-0_43e94c3b-60b2-463c-bb0c-bb10d153e49d_0",namespace="node-density-heavy-0",pod="perfapp-1-1-bc966c69-h6c77"} 1.295762 1769503671596
cAdvisor emits PSI metrics for every relevant cgroup. For a pod with a single application container, this means:
3 containers × 6 PSI metric types = 18 total PSI metrics per pod
Dropping the "" and "POD" containers would eliminate approximately 66% of the PSI series. Is it possible to reduce the Prometheus scrape effort and resource usage?
Reducing Prometheus resource usage
The metrics pipeline has three stages: Emit, scrape, and query. In this context, that is:
cAdvisor → Prometheus → query result
You can't (yet) suppress emission at the source
It's not possible yet to configure Kubernetes/cAdvisor/CRI-O to suppress PSI metrics for pause and pod cgroups (the "" and "POD" containers) at their source. There are no known configuration options for this approach, but there is an issue on GitHub to discuss this option.
Metric relabeling
Configure Prometheus metric relabeling to drop PSI metrics for non-application containers. This approach reduces:
- Scrape payload size: Less data transferred during collection
- Series count: Fewer time series stored in Prometheus
- Head memory: Lower RAM usage for active series
- WAL churn: Reduced write-ahead log activity
Implementation example (unsupported)
The following configuration drops PSI metrics for POD, and pauses containers:
apiVersion: v1
kind: ConfigMap
metadata:
  name: cluster-monitoring-config
  namespace: openshift-monitoring
data:
  config.yaml: |
    kubelet:
      metricRelabelings:
      - sourceLabels:
        - __name__
        - container
        regex: container_pressure_.*;(POD|)
        action: drop
This configuration is not supported in OpenShift's built-in cluster monitoring operator. Attempting to apply this configuration in OpenShift results in the following error:
error when patching "cluster-monitoring-config.yaml": admission webhook "monitoringconfigmaps.openshift.io" denied the request: failed to parse data at key "config.yaml": error unmarshaling: unknown field "kubelet"The OpenShift cluster monitoring operator only exposes a subset of Prometheus configuration parameters. According to the config map reference for the cluster monitoring operator:
> Not all configuration parameters for the monitoring stack are exposed. > Only the parameters and fields listed in this reference are supported for configuration.
OpenShift does not support customizing the kubelet ServiceMonitor. Using a custom Prometheus deployment outside of the managed monitoring stack is not recommended for production.
PromQL query filter
Filtering in PromQL using container!="", container!="POD" only affects query results and provides no resource savings. This approach is useful for data visualization, but it doesn't address the underlying resource consumption issues.
Test conclusion
The test shows that PSI enablement has a measurable memory impact on Prometheus pods. With 500+ test containers on a cluster as baseline, enabling PSI causes Prometheus pod RSS to increase up to 1.3+ GB per Prometheus pod — a 42% increase from baseline memory consumption.
However, there is no observable impact on kubelet CPU or memory usage.
Based on a performance evaluation with 500+ test containers, here are some recommendations when enabling PSI:
- Prometheus capacity planning: Allocate an additional 1.4 GB RSS per Prometheus pod before enabling PSI. For clusters exceeding 500 test containers, scale this allocation proportionally.
- Monitoring: Closely monitor Prometheus pod memory usage after enabling PSI.
- Kubelet performance: Kubelet performance remains stable with 500+ test containers after enabling PSI.
Learn more
To learn more about PSI, kubelet PSI metrics, and Prometheus, check out these resources: