Storage prices are decreasing, while business demands are growing, and companies are storing more data than ever before. Following this growth pattern, demand grows for monitoring and data protection involving software-defined storage. Downtimes have a high cost that can directly impact business continuity and cause irreversible damage to organizations. Aftereffects include loss of assets and information; interruption of services and operations; law, regulation, or contract violations; along with the financial impacts from losing customers and damaging a company's reputation.
Gartner estimates that a minute of downtime costs enterprise organizations $5,600, and an hour costs over $300,000.
On the other hand, in a DevOps context, it's essential to think about continuous monitoring, which is a proactive approach to monitoring throughout the full application's life cycle and that of its components. This approach helps identify the root cause of possible problems and then quickly and proactively prevent performance issues or future outages. In this article, you will learn how to implement Ceph storage monitoring using the enterprise open source tool Zabbix.
What is Ceph storage?
Ceph storage is an open source software-defined storage system with petabyte-scale and distributed storage, designed mainly for cloud workloads. While traditional NAS or SAN storage solutions are often based on expensive proprietary hardware solutions, software-defined storage is usually designed to run on commodity hardware, which makes these systems less expensive than traditional storage appliances.
Ceph storage is designed primarily for the following use cases:
- Image and virtual block device storage for an OpenStack environment (using Glance, Cinder, and Nova).
- Object-based storage access for applications that use standard APIs.
- Persistent storage for containers.
According to the Ceph documentation, whether you want to provide object storage or block device services to cloud platforms, deploy a filesystem, or use Ceph for another purpose, all storage cluster deployments begin with setting up a node, your network, and the storage cluster. A Ceph storage cluster requires at least one monitor (ceph-mon), one manager (ceph-mgr), and an object storage daemon (ceph-osd). The metadata server (ceph-mds) is also required when running Ceph File System (CephFS) clients. These are some of the many components that will be monitored by Zabbix. To learn more about what each component does, read the product documentation.
Here we are proposing a lab, but if you are planning to do this in production, you should review hardware and the operating system recommendations first.
What is Zabbix and how can it help?
Zabbix is an enterprise-class open source distributed monitoring system. It monitors numerous network parameters and the health and integrity of servers. Zabbix uses a flexible notification mechanism that lets users configure email-based alerts for virtually any event, which provides a fast reaction to server problems. This tool also offers excellent reporting and data visualization features based on the stored data and so is ideal for capacity planning.
It supports both polling and trapping. All reports and statistics, as well as configuration parameters, are accessed through a web-based frontend. This front end ensures that the status of your network and the health of your servers can be assessed from any location. Properly configured, Zabbix can play an important role in monitoring IT infrastructure. This fact is equally true for small organizations with a few servers and for large companies with a multitude of servers. I won't cover Zabbix installation here, but there is a great guide and a video in the official documentation.
The Ceph Manager daemon
Added in Ceph 11.x (also known as Kraken) and Red Hat Ceph Storage version 3 (also known as Luminous), the Ceph Manager daemon (ceph-mgr) is required for normal operations, runs alongside monitor daemons to provide additional monitoring, and interfaces to external monitoring and management systems. At the same time, you can create modules and extend managers to provide new features. Here, we will use this ability through a Zabbix Python module that is responsible for exporting overall cluster status and performance to Zabbix server, which is the central process that performs monitoring, interacts with Zabbix proxies and agents, calculates triggers, and sends notifications—a central data repository. Obviously, you can still collect traditional metrics about your operational systems, but the Zabbix Python module will gather specific information about storage metrics and performance and send it to the Zabbix server.
Here are some examples of available metrics:
- Ceph performance, such as I/O operations, bandwidth, and latency.
- Storage utilization and overview.
- Object storage daemon (OSD) status and how many are in or up.
- Number of monitors (mons) and OSDs.
- Number of pools and placement groups.
- Overall Ceph status.
The lab environment
Ceph cluster installation will not be covered here, but you can find more information about how to do that in the Ceph documentation. My storage cluster was installed using ceph-ansible.
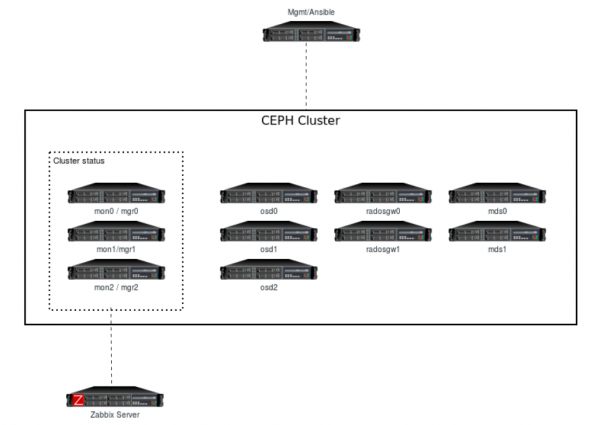
The computing resources used were 12 instances with the same configuration, including two CPU cores, 4GB of RAM, and:
- Three monitor nodes and three manager nodes (colocated).
- Three OSD nodes with three disks per node (nine OSDs in total).
- Two metadata server (MDS) nodes.
- Two RADOS Gateway nodes.
- One Ansible management node.
- One Zabbix server node colocated (Zabbix server, MariaDB server, and Zabbix front end).
See Figure 1 for the resulting cluster's topology.
The software resources this lab used are:
- The base OS for all instances: Red Hat Enterprise Linux 7.7
- Cluster storage nodes: Red Hat Ceph Storage 4.0
- Management and automation: Ansible 2.8
- Monitoring: Zabbix 4.4
Considering that my cluster is installed and ready, here is the health, service, and task status:
[user@mons-0 ~]$ sudo ceph -s
  cluster:
    id:     7f528221-4110-40d7-84ff-5fbf939dd451
    health: HEALTH_OK
  services:
    mon: 3 daemons, quorum mons-1,mons-2,mons-0 (age 37m)
    mgr: mons-0(active, since 3d), standbys: mons-1, mons-2
    mds: cephfs:1 {0=mdss-0=up:active} 1 up:standby
    osd: 9 osds: 9 up (since 35m), 9 in (since 3d)
    rgw: 2 daemons active (rgws-0.rgw0, rgws-1.rgw0)
  task status:
  data:
    pools:   8 pools, 312 pgs
    objects: 248 objects, 6.1 KiB
    usage:   9.1 GiB used, 252 GiB / 261 GiB avail
    pgs:     312 active+clean
How to enable the Zabbix dashboard module
The Zabbix module is included in the ceph-mgr package and you must deploy your Ceph cluster with a manager service enabled. To enable the Zabbix module with a single command in one of the ceph-mgr nodes, use this:
[user@mons-0 ~]$ sudo ceph mgr module enable zabbix
You can check if the Zabbix module is enabled through the following command:
[user@mons-0 ~]$ sudo ceph mgr module ls | head -5
{
"enabled_modules": [
"dashboard",
"prometheus",
"zabbix"
Sending data from the Ceph cluster to Zabbix
This solution uses the Zabbix sender utility, which is a command-line tool that can send performance data to Zabbix server for processing purposes. The utility is often used in long-running user scripts for periodically sending availability and performance data. It can be installed on most distributions using the package manager. You should install the zabbix_sender executable on all machines running ceph-mgr for high availability.
Let's enable Zabbix repositories and install zabbix_sender in all Ceph Manager nodes:
[user@mons-0 ~]$ sudo rpm -Uvh https://repo.zabbix.com/zabbix/4.4/rhel/7/x86_64/zabbix-release-4.4-1.el7.noarch.rpm
[user@mons-0 ~]$ sudo yum clean all
[user@mons-0 ~]$ sudo yum install zabbix-sender -y
Alternatively, you can automate this installation. Instead of running three commands on three different nodes, use Ansible to run them together as a single command in each of the three manager nodes:
[user@mgmt ~]$ ansible mgrs -m command -a "sudo rpm -Uvh https://repo.zabbix.com/zabbix/4.4/rhel/7/x86_64/zabbix-release-4.4-1.el7.noarch.rpm"
[user@mgmt ~]$ ansible mgrs -m command -a "sudo yum clean all"
[user@mgmt ~]$ ansible mgrs -m command -a "sudo yum install zabbix-sender -y"
Configuring the module
After understanding how everything works, you just need a piece of configuration to make this module work accurately. The two required items are zabbix_host and the identifier (an item is a particular piece of data that you want to receive from a host, a metric of data). The zabbix_host setting points to the Zabbix server's host name or IP address, to which zabbix_sender will send the items as a trap, while identifier is a Ceph cluster identifier parameter in Zabbix. This parameter controls the identifier/host name to use as the source when sending items to Zabbix. This setting should match the name of the host in your Zabbix server.
Note: If you don't configure the identifier parameter, the ceph-<fsid> of the cluster will be used when sending data to Zabbix. The result would be, for example, ceph-c6d33a98-8e90-790f-bd3a-1d22d8a7d354.
Optionally, you have many other configuration keys that can be configured. Here are a few with their default values:
zabbix_port: TCP port where Zabbix server runs (default: 10051).zabbix_sender: Path for the Zabbix sender binary (default:/usr/bin/zabbix_sender).interval: Update interval for the specified time period during whichzabbix_sendersends the data for Zabbix server (default: 60 seconds).
Configuring your keys
Configuration keys can be set on any server with the proper CephX credentials. These are usually monitors, where the client.admin key is available:
[user@mons-0 ~]$ sudo ceph zabbix config-set zabbix_host zabbix.lab.example
[user@mons-0 ~]$ sudo ceph zabbix config-set identifier ceph4-cluster-example
[user@mons-0 ~]$ sudo ceph zabbix config-set interval 120
The module's current configuration can also be shown through the following command:
[user@mons-0 ~]$ sudo ceph zabbix config-show
{"zabbix_port": 10051, "zabbix_host": "zabbix.lab.example", "identifier": "ceph4-cluster-example", "zabbix_sender": "/usr/bin/zabbix_sender", "interval": 120}
Exploring Zabbix: Templates, host creation, and dashboards
It's time to import your template. In the Zabbix world, a template is a set of entities that can be conveniently applied to multiple hosts. These entities might be items, triggers, graphs, discovery rules, etc. Your base will be the items. When a template is linked to a host, all entities in the template are added to the host. Templates are assigned to each individual host directly.
Take a moment to download the Zabbix template for Ceph, which is available in the source directory as an XML file:
[user@mylaptop ~]$ curl https://raw.githubusercontent.com/ceph/ceph/master/src/pybind/mgr/zabbix/zabbix_template.xml -o zabbix_template.xml
It's important to download this template file locally in raw mode or you will have problems importing in the next step. Then, to import the template into Zabbix (as shown in Figure 2), do the following:
- Go to Configuration → Templates.
- Click on Import to the right.
- Select the import file.
- Click the Import button.
- Click Import.
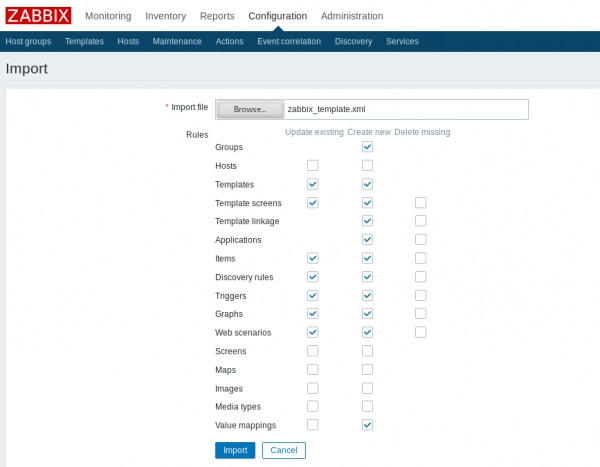
Afterward, an import success or failure message will be displayed in the front end. Once you import the template successfully, configure a host in the Zabbix front end and link to the newly created template (as shown in Figure 3) by doing the following:
- Go to Configuration → Hosts.
- Click on the Create host button to the right.
- Enter the host name and the group(s).
- Link the Ceph template.
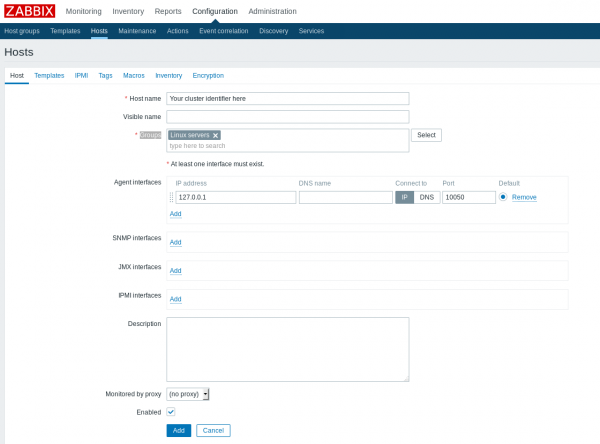
Host name and Groups are required fields. Make sure that the host has the same name as the identifier configured in the Ceph config-key parameter. There are many groups available, and you can either choose one or create a new one. For the purpose of this lab, choose Linux servers.
In the Templates tab (as shown in Figure 4), choose the ceph-mgr Zabbix module that you imported before, and click Select. When that dialog box closes, click Add.

Now your configuration is complete. After a few minutes, data should start to appear in the Zabbix web interface under the Monitoring -> Latest Data menu, and graphs will start to populate for the host. Many triggers are already configured in the template, which will send out notifications if you configure your actions and operations.
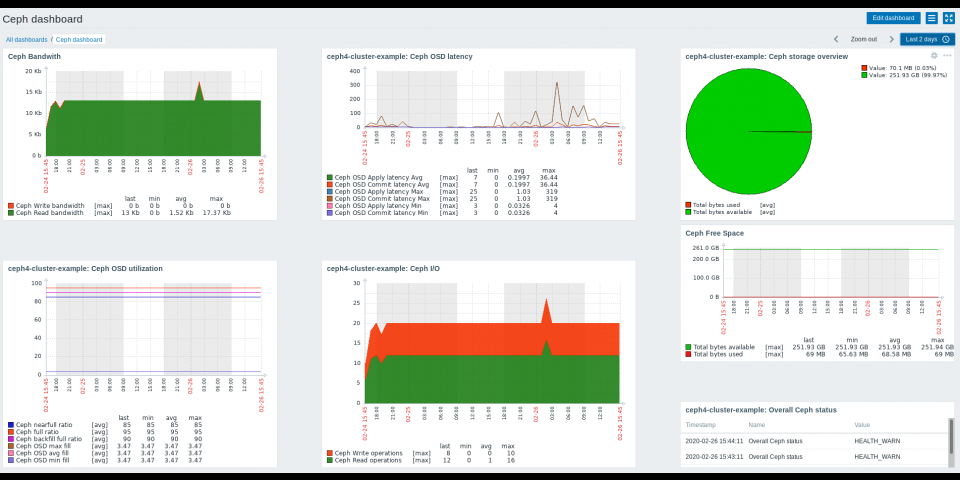
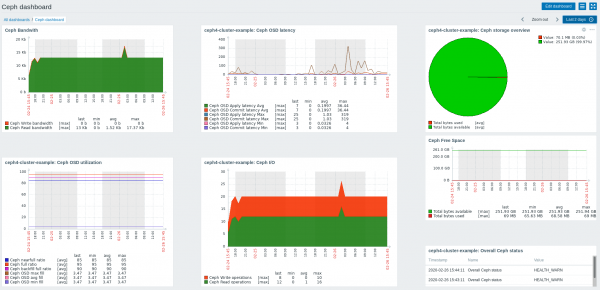
After the data is collected, you can easily create Ceph dashboards and have fun with Zabbix, as shown in Figure 5:
Conclusion
In this article, you learned how to build a monitoring system for Ceph storage using Zabbix. This system improves your visibility into your storage system's health, which helps you proactively identify possible failed events and performance issues before they impact your applications and even your business's continuity.
Last updated: March 29, 2023