Microservices provide a modern approach to development, which is compliant with the cloud environment and gives us the ability to create cloud-native applications. With microservices, we promote resilience, fault tolerance, and scale; however, a microservice approach also presents different challenges than monolithic applications because of its distributed nature.
One of these challenges involves monitoring and logging, which naturally brings us to the concept of observability. In this article, we'll look at how Eclipse MicroProfile can help you implement observability in microservices.
What is observability?
The concept of observability comes from the control theory, that is, a math theory.
Formally, a system is said to be observable if, for any possible sequence of state and control vectors (the latter being variables whose values one can choose), the current state (the values of the underlying dynamically evolving variables) can be determined in finite time using only the outputs. — Wikipedia
Some developers define observability in a microservice architecture as the set of metrics, logging, and tracing tools, but I think observability is a more general concept. Metrics, logging, and tracing are simply ways to provide observability.
To me, observability is the capacity of a system to expose precise information about its states in a quick and easy way. Unlike monitoring, observability is about the system. When we talk about monitoring, the focus is on the tools used to monitor the system, which can be easy or hard to monitor. When we talk about observability, the focus is on the system itself and the need to provide this information in an easier and faster way.
Observability with MicroProfile
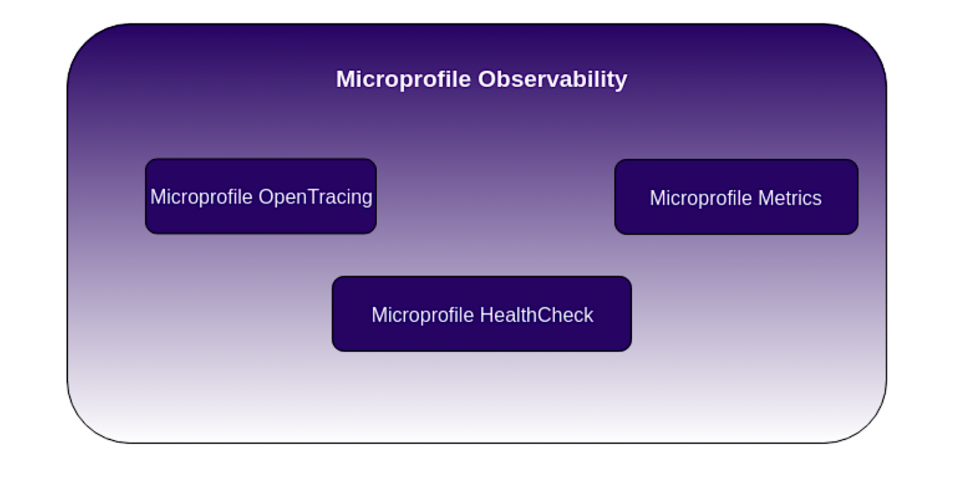
With the aim of supporting easy observability, MicroProfile has specifications that let the developer implement observability in microservices. MicroProfile has three main specifications for this: Microprofile OpenTracing, MicroProfile Metrics, and MicroProfile HealthCheck—all of which we'll look at here.

MicroProfile OpenTracing
The MicroProfile OpenTracing specification permits us to use distributed tracing using the OpenTracing API to trace the flow of a request across a service. This specification is compatible with Zipkin and Jaeger, and it permits us to use those tools to show information about the distributed tracing. Below is an example of how to use MicroProfile OpenTracing.
@Path("subjects")
@Traced
public  SubjectEndpoint {
MicroProfile Metrics
MicroProfile Metrics is a specification that permits us to expose metrics information about our applications. With this, we can expose precise metrics to be consumed more quickly and easily. Below is an example of how to use MicroProfile Metrics.
@Counted
public CounterBean() {
}
MicroProfile HealthCheck
The MicroProfile HealthCheck spec permits us to expose if the application is up or down in our environment. It works as a Boolean response (yes or no) to the question, "Is my application still running ok?". Below is an example of how to use MicroProfile HealthCheck.
@Health
@ApplicationScoped
public class ApplicationHealthCheck implements HealthCheck {

    @Override
    public HealthCheckResponse call() {
        return HealthCheckResponse
                .named("application-check").up()
                .withData("CPUAvailable", Runtime.getRuntime().availableProcessors())
                .withData( "MemoryFree", Runtime.getRuntime().freeMemory())
                .withData("TotalMemory", Runtime.getRuntime().totalMemory())
                .build();
    }
}
Conclusion
Eclipse MicroProfile provides several solutions to microservice challenges, including various specifications to promote observability in our microservices. With these specs, we can use MicroProfile with Jaeger, Zipkin, Prometheus, and other tools to promote better observability and monitoring. I will provide more details of these specs and how to use them in upcoming articles.
Last updated: July 1, 2020
