A large bank in the Association of Southeast Asian Nations (ASEAN) plans to develop a new mobile back-end application using microservices and container technology. They expect the platform to be able to support 10,000,000 customers with 5,000 TPS. They decided to use Red Hat OpenShift Container Platform (OCP) as the runtime platform for this application. To ensure that this platform is able to support their throughput requirements and future growth rate, they have performed internal load testing with their infrastructure and mock-up services. This article will share the lessons learned load testing Red Hat OpenShift Container Platform.
Red Hat OpenShift Container Platform Architecture
The picture below shows the deployment architecture of OCP in a non-production environment, which is the load testing environment. The OCP version is version 3.5.
The architecture is composed of 2 Infrastructure nodes, 3 Master nodes, 3 Application nodes, and 3 Logging and Metric nodes. The load balancer is F5 and the persistent storage is NFS:
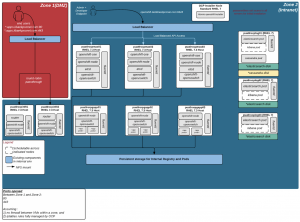
Picture 1: Red Hat OpenShift Container Platform Deployment Architecture
Load Test Scenario
In order to do load testing, the bank creates a mock-up REST service to emulate their mobile backend service. The service is called “Data Service” which is responsible to add, update, and select data from the persistent storage. The “Data Service” is developed using Node.js framework while the persistent storage is based on Redis data caching technology. Both “Data Service” and “Redis” are deployed as Pods on OCP. “Data Service” is exposed as a Secure Route:
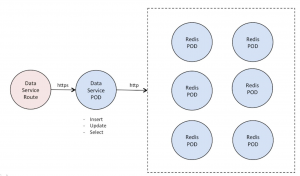
Picture 2: Mockup services for load test
HP LoadRunner is the standard non-functional testing tool of the bank. Therefore for this load testing, the bank uses HP LoadRunner.
The Secure Route is using edge termination TLS. With edge termination, TLS termination occurs at the router, prior to proxying traffic to its destination. The front end of the router serves TLS certificates, so they must be configured into the route, otherwise, the router’s default certificate will be used for TLS termination. For this test, the router’s default certificate is used:
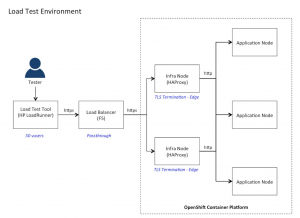
Picture 3: Load Test SSL Scenario
Load Test Activities and Results
The bank has performed load testing and fine-tuning to achieve their expected throughput results. These are the load testing activities that they have completed for a few weeks:
1. Load Test with Default Configuration (HP LoadRunner)
- 2 Infra nodes (4 cores) with 2 Routers.
- 3 Application nodes (8 cores).
- 1 Data Service pod and 6 Redis pod.
- 1 HP LoadRunner server with 50 vuser.
| No. | Data Service | Infra Node CPU cores | No of Data Service pod | E2E Throughput | Data Service Response Time | E2E Response Time | Infra Node CPU Usage | Data Service CPU Usage |
| 1 | Add Service | 4 cores | 1 pod | 350 TPS | 1 ms | 150 ms | 25% | Low (< 1 core) |
Observation of Results:
- The E2E throughput is way too low compared to the expected throughput. The response time at the service level is less than 1 ms while the E2E response time is 150 ms. The suspected culprit of the root cause is the TLS termination process at the Router node.
- The 2 Infra nodes can have only 2 Router pods and cannot scale out anymore. With Red Hat support, the bank noticed that the Router pod is a "special" pod, and it opens/uses port 80 of the Node host. So, 1 Router can only be deployed on 1 Infra node.
- The CPU of the Router pod is limited to 1 core and cannot be increased. With Red Hat support, the bank found that the default nbproc of HAProxy is 1. nbproc is the number of HAProxy processes spawned within the Router pod. Also, nbproc=1 is the only supported value for OCP. [Ref1]
- The CPU utilization of infra node is very low and limited to only one core. With Red Hat support, the bank found that in the Red Hat OpenShift Container Platform, HAProxy Router runs as a single process. [Ref2]
- It may be possible to improve performance using CPU pinning by customizing the HAProxy Router using a ConfigMap for example. [Ref3]
Next Action:
Based on the results observed above (and after discussing this with Red Hat), the bank decided to adjust the infrastructure and configuration as shown below:
- For the infrastructure node, increase the number of CPU cores from 4 to 8 cores.
- Adjust the router configuration:
- Set nbproc=6
- Set cpu-map
2. Load Test with Router Configuration Adjustment (HP LoadRunner)
- 2 Infra nodes (8 cores) with 2 Routers.
- 3 Application nodes (8 cores).
- 6 Data Service pod and 6 Redis pod.
- 1 HP LoadRunner server with 50 vuser.
With this configuration, they found that the throughput is significantly improved. However, the response time at the Data Service and CPU utilization of the Data Service pod is still high. Therefore, the bank decided to increase the number of pods from 1 to 6. The table below shows the load test result:
| No. | Data Service | Infra Node CPU cores | No of Data Service pod | E2E Throughput | Data Service Response Time | E2E Response Time | Infra Node CPU Usage | Data Service CPU Usage |
| 1 | Add Service | 8 cores | 6 pod | 600 TPS | 1 ms | 20 ms | 80% | 0.3 core |
Result Observation:
- The E2E throughput is improved about 2 times and the CPU of infra nodes are fully utilized.
- The E2E response is significantly reduced from 150 ms to 20 ms.
- The load can go to the Data Service more, so it has to scale out to 6 pods to handle more workload.
- The CPU Utilization of the infrastructure node is very high.
- The bank found the error -27774 “Server shut connection during attempt to negotiate SSL connection” occurs at HP LoadRunner tool a lot. When this error starts occurring, the throughput starts dropping. The error rate is about 5%. Also, the CPU utilization of the load test tool is very high, about 80-90%.
Next Action:
Based on the above findings, the bank decided to adjust the infrastructure and configuration as below:
- Increase the number of CPU cores from 8 to 16 cores in the Infrastructure nodes.
- Adjust the router configuration:
- Set nbproc=15
- Set cpu-map
- Increase the number of HP LoadRunner server from 1 to 2.
3. Load Test with Router Configuration Adjustment
- 2 Infra nodes (16 cores) with 2 Routers.
- 3 Application nodes (8 cores).
- 6 Data Service pods and 6 Redis pods.
- 2 HP LoadRunner servers with 50 vuser.
| No. | Data Service | Infra Node CPU cores | No of Data Service pod | E2E Throughput | Data Service Response Time | E2E Response Time | Infra Node CPU Usage | Data Service CPU Usage |
| 1 | Add Service | 16 cores | 6 pod | 1000 TPS | 1 ms | 20 ms | 30% | 0.3 core |
Result Observation:
- The E2E throughput is improved from 600 to 1000 TPS.
- Increasing the number of CPU cores of Infra node reduces the CPU utilization from 80% to 30%.
- The bank still found the error -27774 at HP LoadRunner tool occurs a lot. When this error starts occurring, the throughput starts dropping. The error rate is about 1%. The -27774" error of more than 80% could be due to the HP LoadRunner configuration itself.
- The bank did some adjustments on the HAProxy configurations including maxconn, tune.bufsize, tune.ssl.default-dh.param, stats timeout, and timeout check. Anyway, they found that these parameters don’t have any impact on our testing result.
Next Action:
- Because of the error -27774 at HP LoadRunner, the bank decided to explore another load testing tool using JMeter.
4. Load Test with JMeter
- 2 Infra nodes (16 cores) with 2 Routers.
- 3 Application nodes (8 cores).
- 6 Data Service pods and 6 Redis pods.
- 1 JMeter server with 100 threads.
After the bank did the load testing with JMeter, they found that the throughput is significantly improved with zero errors. However, the response time at the Data Service is still high and also CPU utilization of the Data Service pod is high. Therefore, they decided to increase the number of Data Service Pods from 6 to 9. The table below shows the load test result:
| No. | Data Service | Infra Node CPU cores | No of Data Service pod | E2E Throughput | Data Service Response Time | E2E Response Time | Infra Node CPU Usage | Data Service CPU Usage |
| 1 | Add/Update Service | 16 cores | 6 pod | 3500 TPS | 1 ms | 20 ms | 30% | 0.3 core |
| 2 | Select Service | 16 cores | 6 pod | 5000 TPS | 1 ms | 20 ms | 30% | 0.3 core |
Result Observation:
- The E2E throughput is significantly improved and nearly meets their target.
- The load can go to the Data Service more, so it has to scale out to 9 pods to handle more workload.
- JMeter as a load testing tool plays a critical factor to the above result. It gives a different perspective and it opens a new horizon on fine tuning other components outside HAProxy.
- The root cause of the low throughput previously might come from HP LoadRunner itself.
Next Action:
- Even though the load test result from JMeter is very good, the bank still needs to continue finding the root cause of HP LoadRunner because it’s the standard non-functional test of the bank.
5. Load Test with some configuration changes on HP LoadRunner
- 2 Infra nodes (16 cores) with 2 Routers.
- 3 Application nodes (8 cores).
- 6 Data Service pods and 6 Redis pods.
- 2 HP LoadRunner servers with 50 users.
After investigating the HP LoadRunner -27774 errors, the bank found that if they change the keep-alive from true to false, the -27774 error rate is dramatically reduced. However, they found another error of high CPU utilization in the load testing server.
They also changed the maximum number of threads running per process (MaxThreadPerProcess) to be able to handle more threads. They also increased the number of load test tool servers from 2 to 5. With these changes, they got these results:
| No. | Data Service | Infra Node CPU cores | No of Data Service pod | E2E Throughput | Data Service Response Time | E2E Response Time | Infra Node CPU Usage | Data Service CPU Usage |
| 1 | Add Service | 16 cores | 6 pod | 5800 TPS | 1ms | 20 ms | 30% | 0.3 core |
Result Observation:
- The load test result with HP LoadRunner meets the customer’s throughput expectation.
- The load test tool configuration is impacting the load test result.
Next Action:
- Because the CPU utilization of infra node is about 30%, the bank will reduce the number of CPU cores of infra node from 16 to 8. Then they will do the load test again. They would like to get the infra node sizing guideline for their platform.
- This load test is based on the router’s default certificate for TLS termination. The bank will use their certification and continue on the load test.
- The bank will do more E2E integration testing with their back-end systems, front-end applications, and security infrastructure.
Lessons Learned and Key Observations from this Load Test
1. Tuning the Router is an important activity to increase the throughput and E2E response time. These are a few of the ways to increase HAProxy performance:
- Allocate enough Infra nodes for Routers, with higher CPU allocation to handle more requests, especially if you are using a Secure Route with edge termination or reencrypt TLS.
- Adjust nbproc value in HAProxy config to map process Vs CPU core. This is relatively experimental; meaning you have to find the best nbproc value Vs your available CPU:
- Example: nbproc=2 for a 4 CPU node often gives more throughput compared to maximizing nbproc value to 4.
- Increase the maxconn config using ROUTER_MAX_CONNECTIONS environment variable in DeploymentConfig. In OCP 3.5 we can modify the maxconn value of HAProxy config to increase the default value of 2000.
- You may also need to adjust the value of timeout connect using: ROUTER_DEFAULT_CONNECT_TIMEOUT, timeout server using ROUTER_DEFAULT_SERVER_TIMEOUT, and then timeout client using ROUTER_DEFAULT_CLIENT_TIMEOUT respectively.
2. The chosen load testing tool is an important factor for the load testing result. It is good to try to another load testing tool to ensure that the root cause of performance degradation is in OCP, and not in the load testing tool itself:
- HP LoadRunner error "Server shut connection during an attempt to negotiate SSL session" of more than 80% is due to an HP LoadRunner configuration issue. These links [k][l][m] provide the information on how to troubleshoot it.
- The other candidates for a load testing tool are JMeter [n] and Gatling [o].
3. Monitor and scale out the service to ensure that it’s able to handle the workload.
Last updated: March 23, 2023