In the first part of this series, you can see how to use and configure Red Hat JBoss Developer Studio in order to develop and deploy on the Next-Gen OpenShift platform. A step-by-step guide was given allowing us to:
- connect to the Next-Gen OpenShift platform from Red Hat JBoss Developer Studio
- deploy and tune a JBoss Enterprise Application Platform based application
- debug the deployed JBoss Enterprise Application Platform based application
In this second part, we will follow the same pattern but for a NodeJS based application.
Deploying and debugging a NodeJS based application
First, we need to create an OpenShift project to host our application. We will use 'mydemo' but you may choose another name. If you have an existing project on the platform, you should use it as it allows only one project per user.
In the OpenShift Explorer view, select the connection we just created, right click it and select the 'New -> Project' menu item. The following wizard will appear:
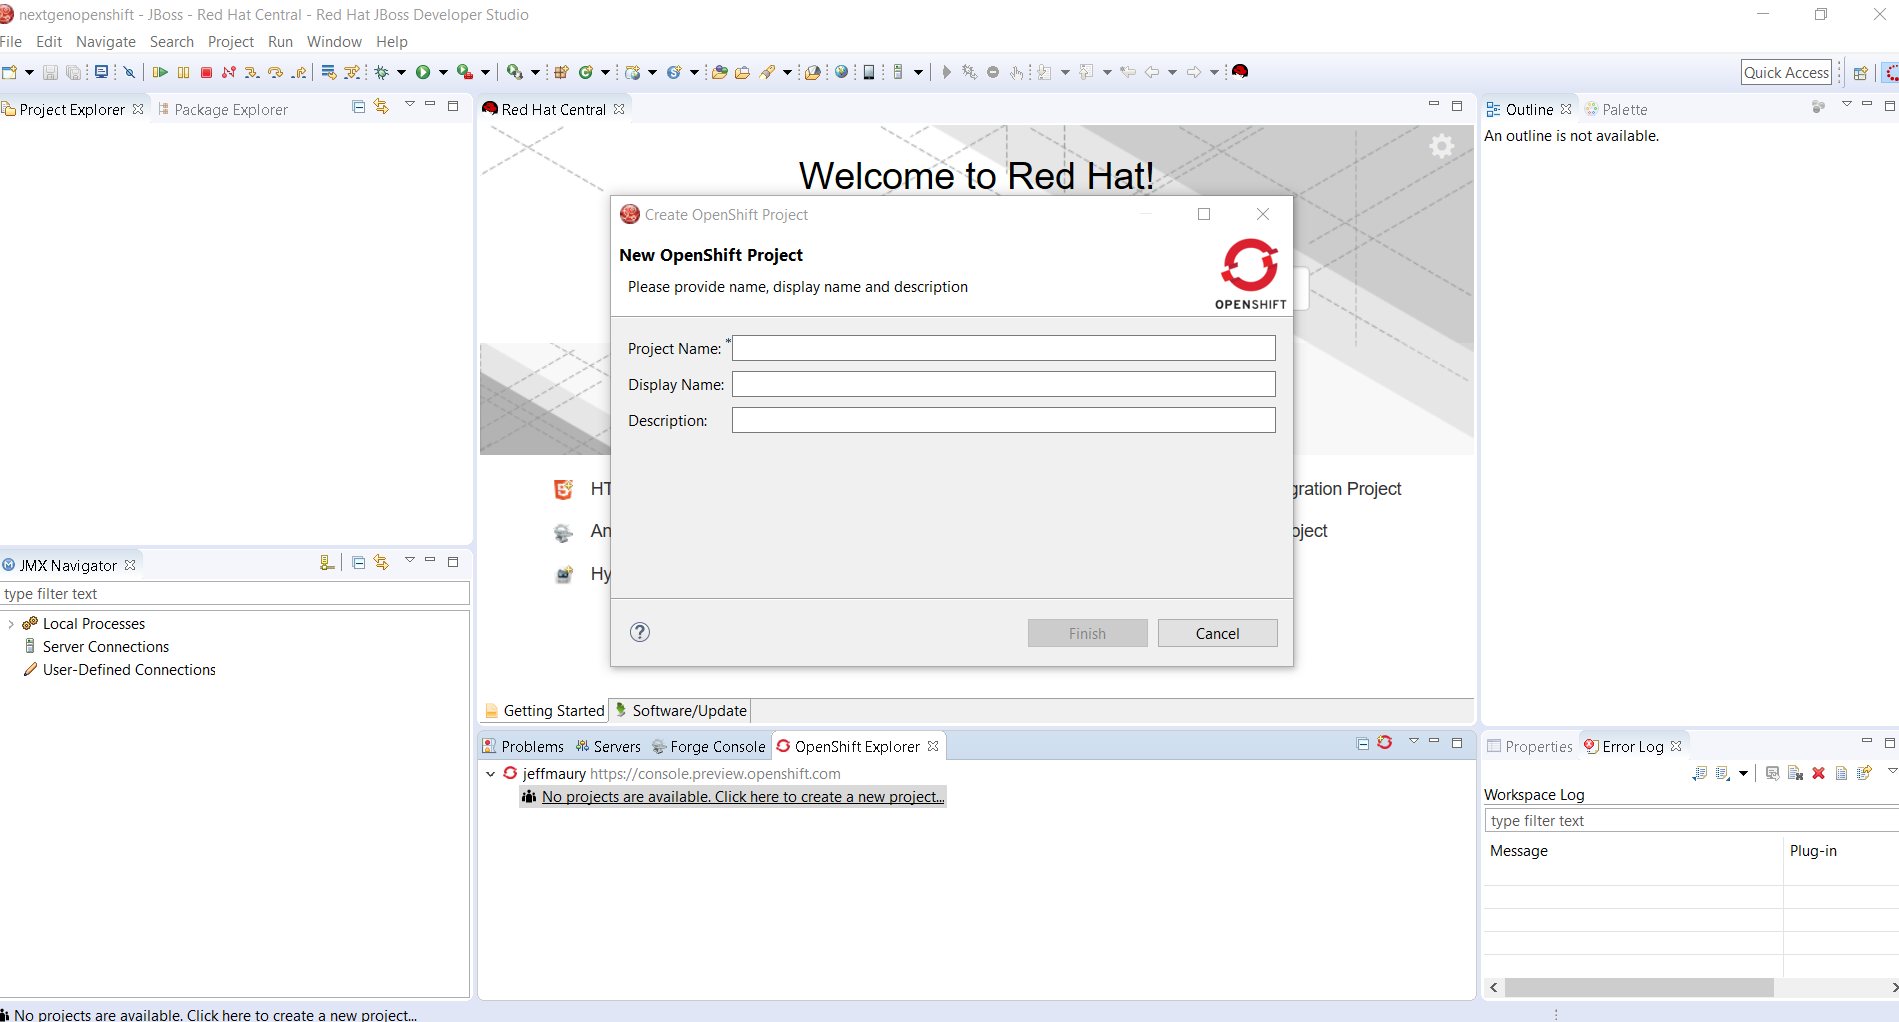
Enter 'mydemo' in the Project Name field and click the Finish button. The OpenShift Explorer view is updated as following:
Deploying the NodeJS based application
Red Hat JBoss Developer Studio provides a wizard for deploying applications onto an OpenShift platform. In the OpenShift Explorer view, right-click the OpenShift project (mydemo) and select the 'New -> Application' menu item. The application wizard will then appear:
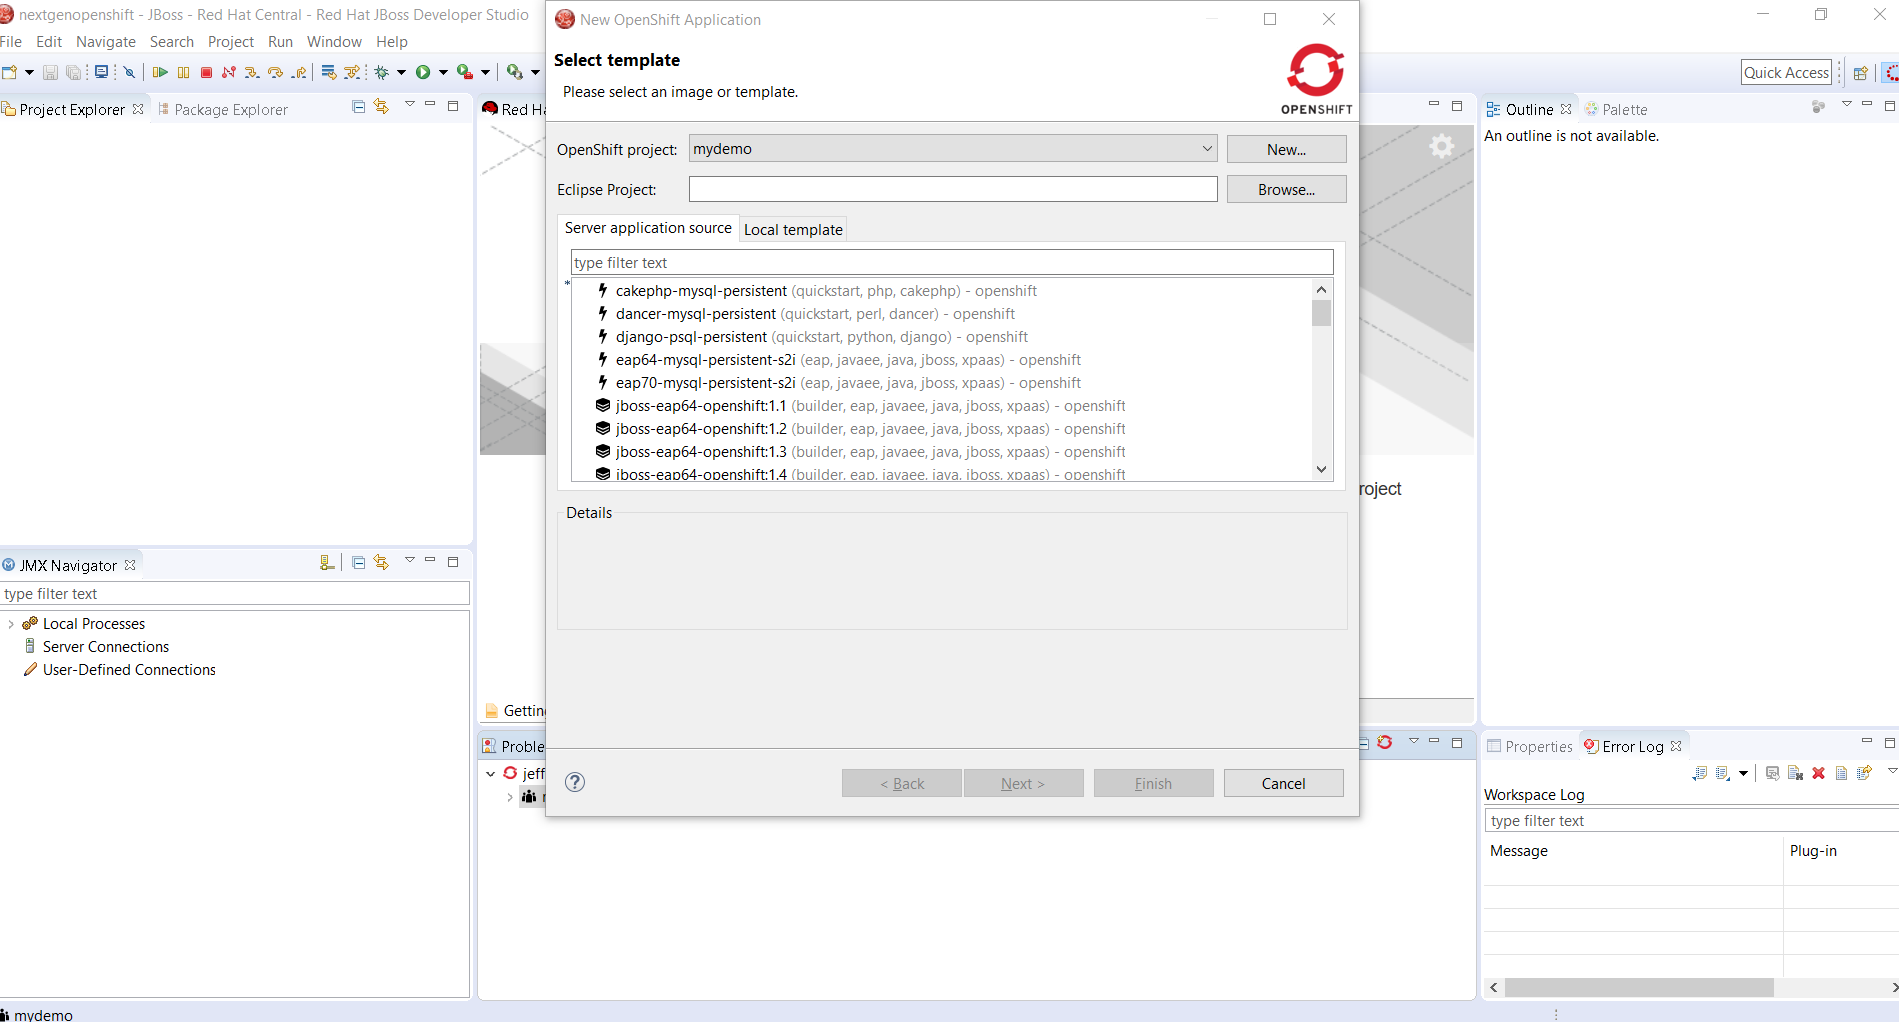
The list of available applications types is then displayed. In order to reduce the available choices, enter 'node' in the filter text field. The display will be updated as following:
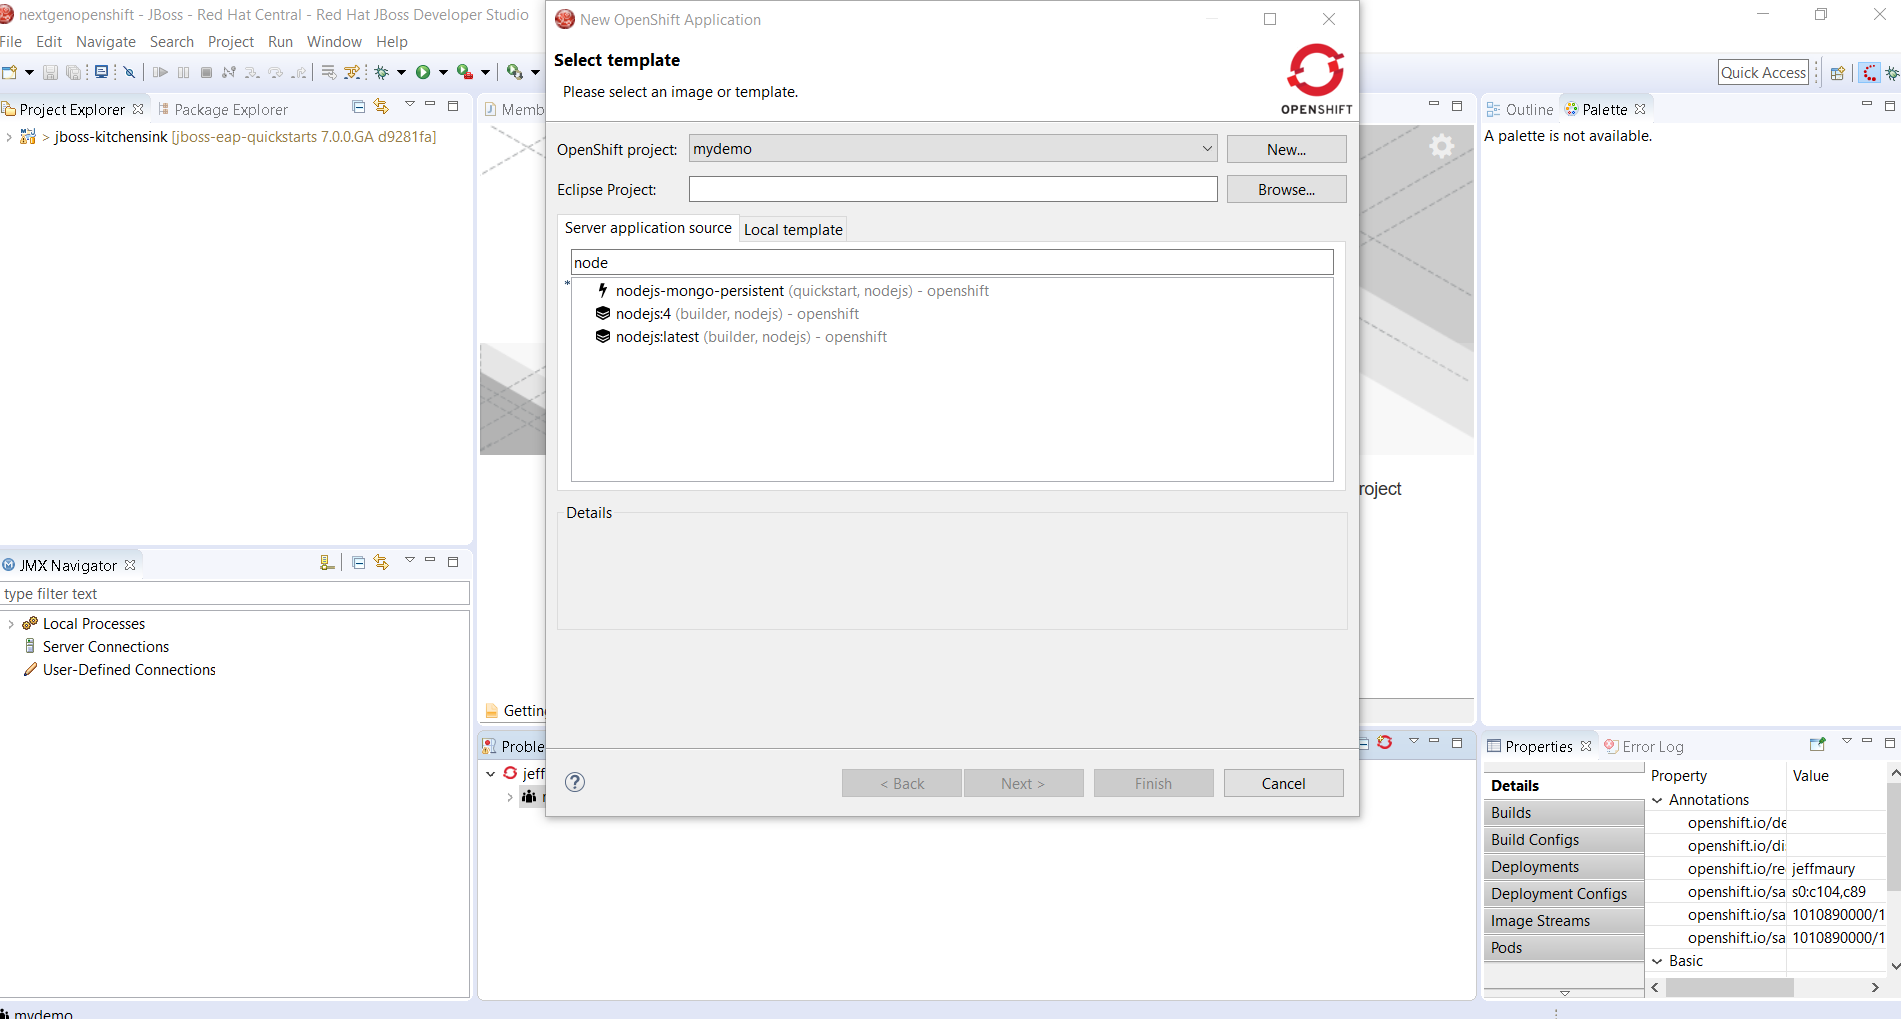
In the list of available application types, select the 'nodejs:latest' item. The Details field will be updated accordingly and the Next button is now enabled. Click it. The wizard will now display the following:
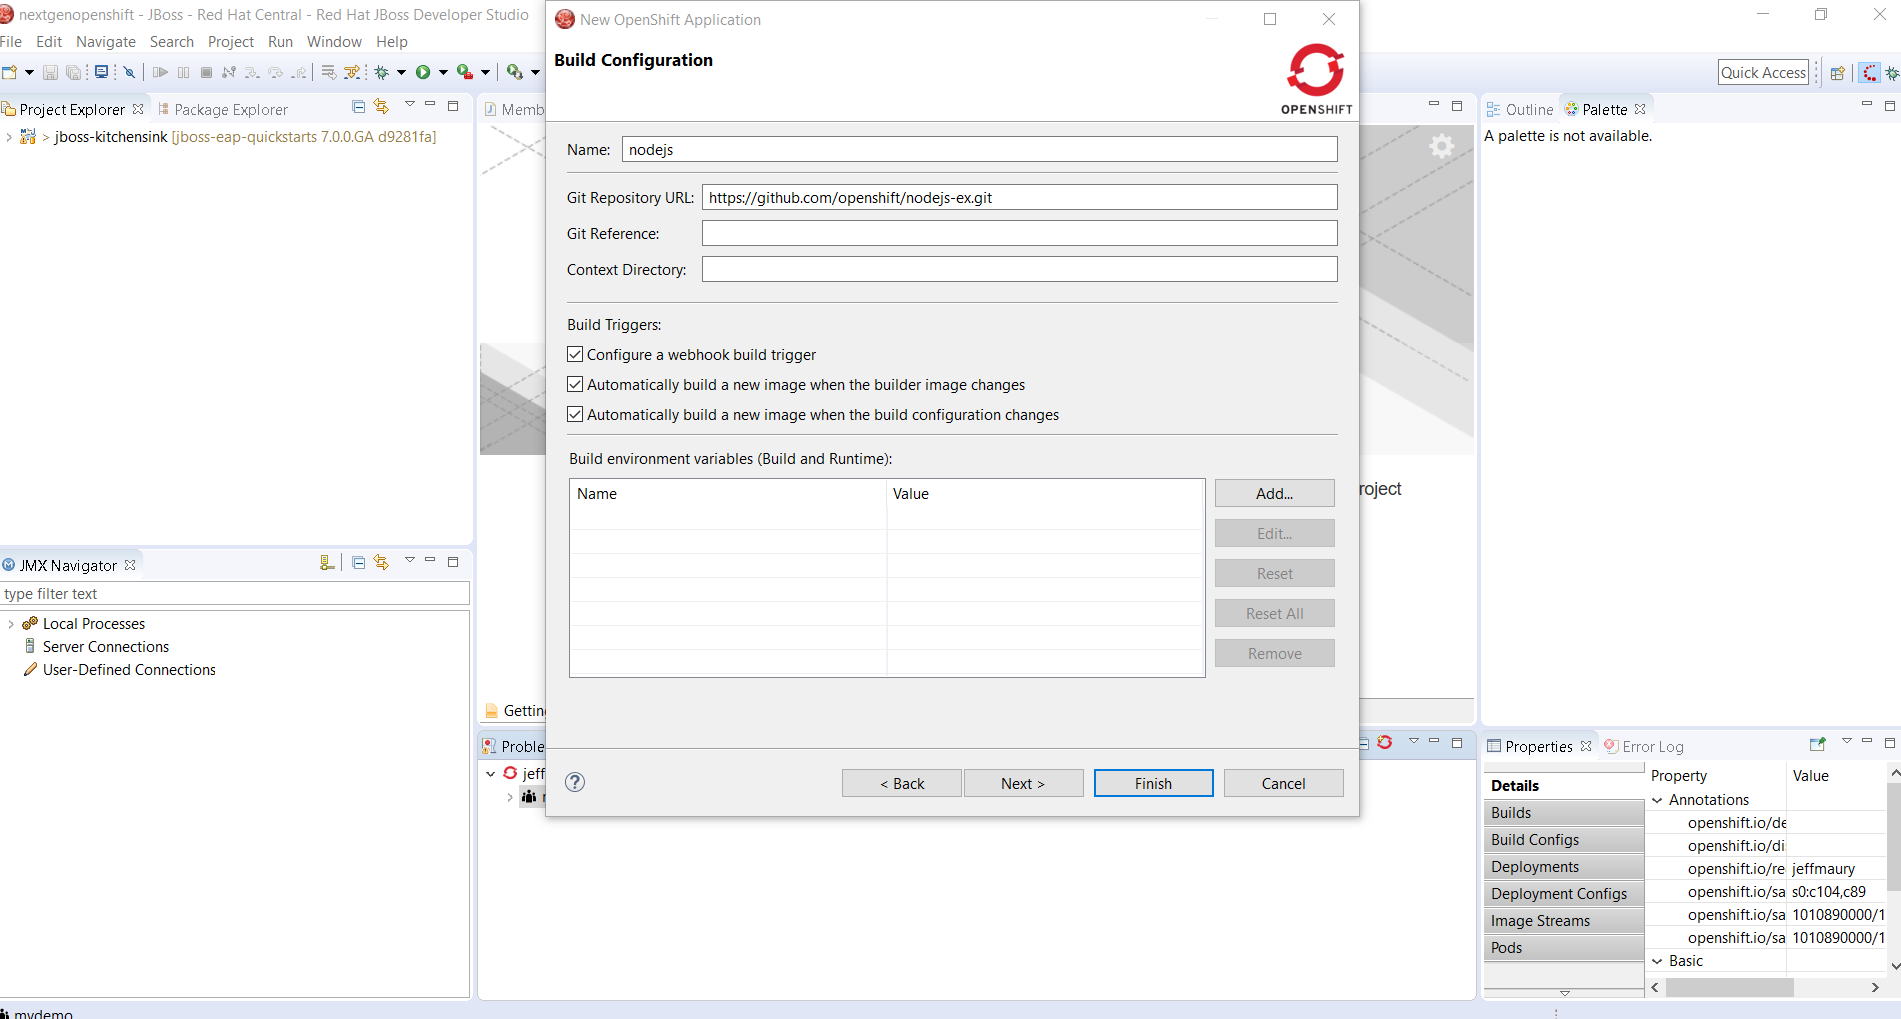
Click on the Finish button. The application will be created on the OpenShift Next-Gen platform and the list of the OpenShift resources is then displayed:
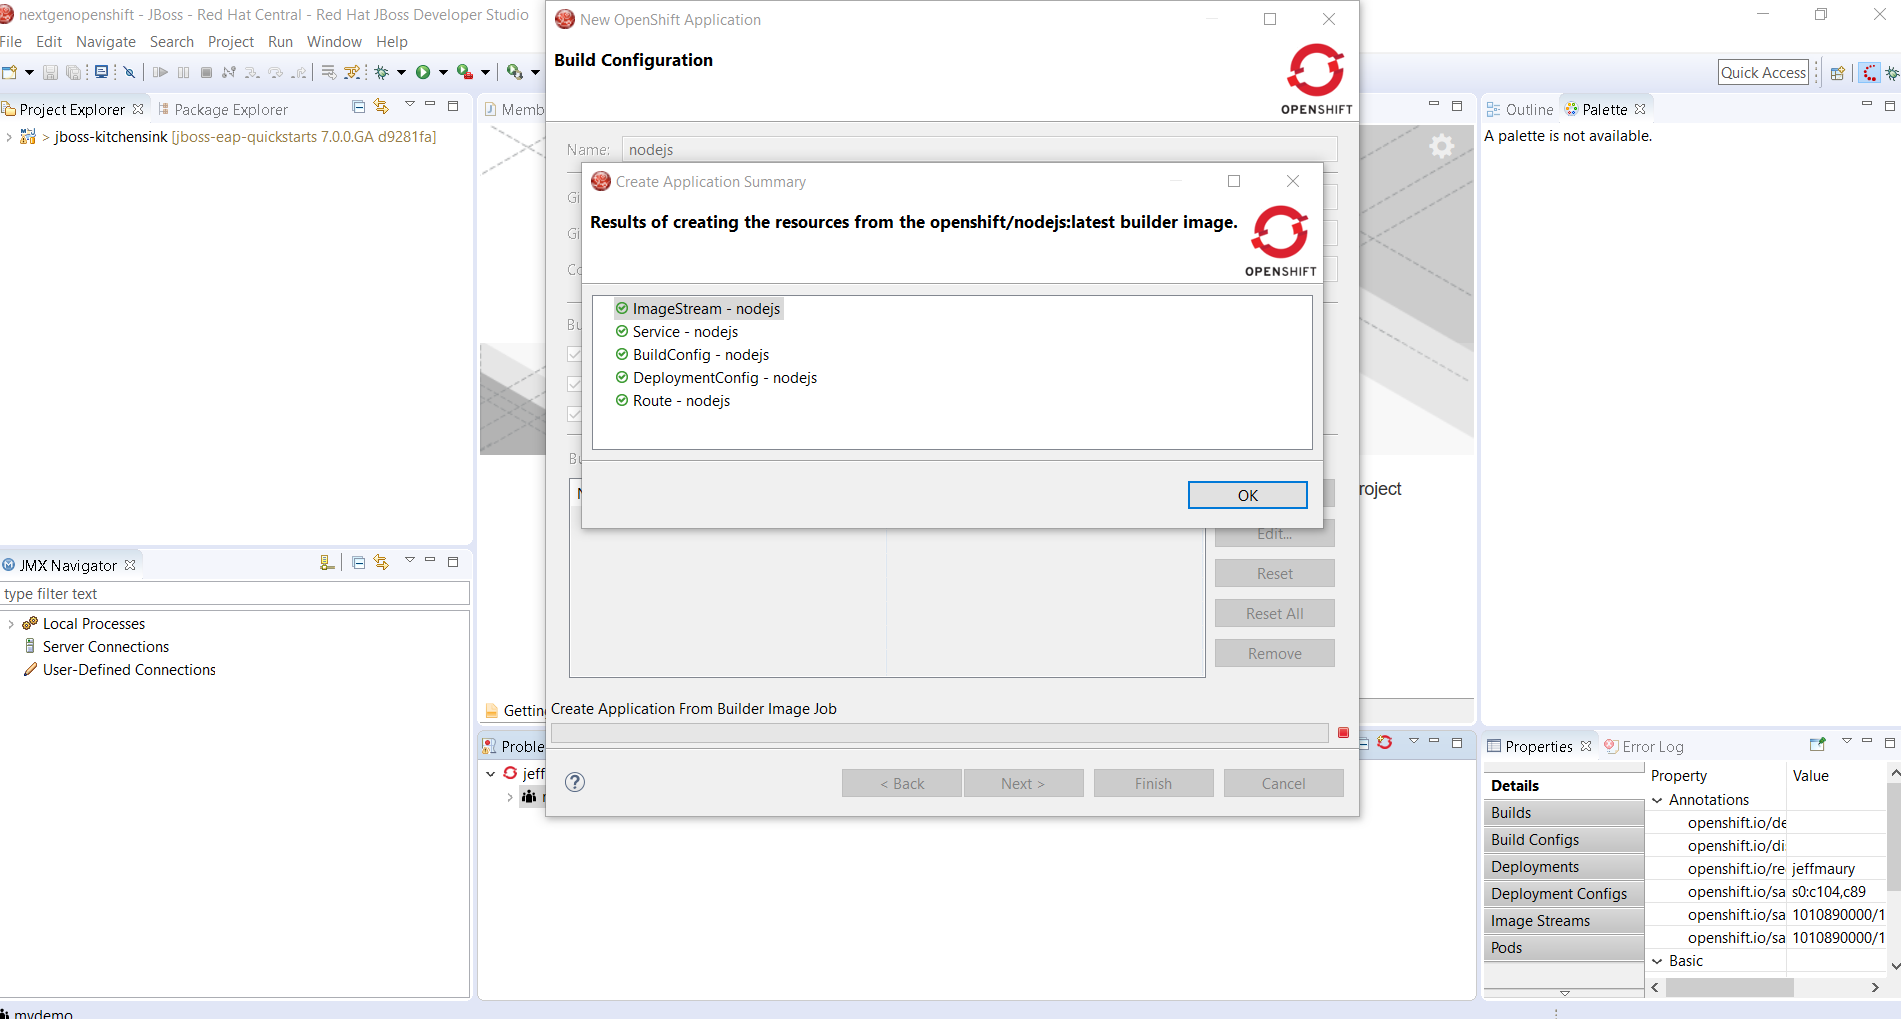
Click the OK button. The deployment will be started and you will see a new wizard for importing the application source files into the local workspace:
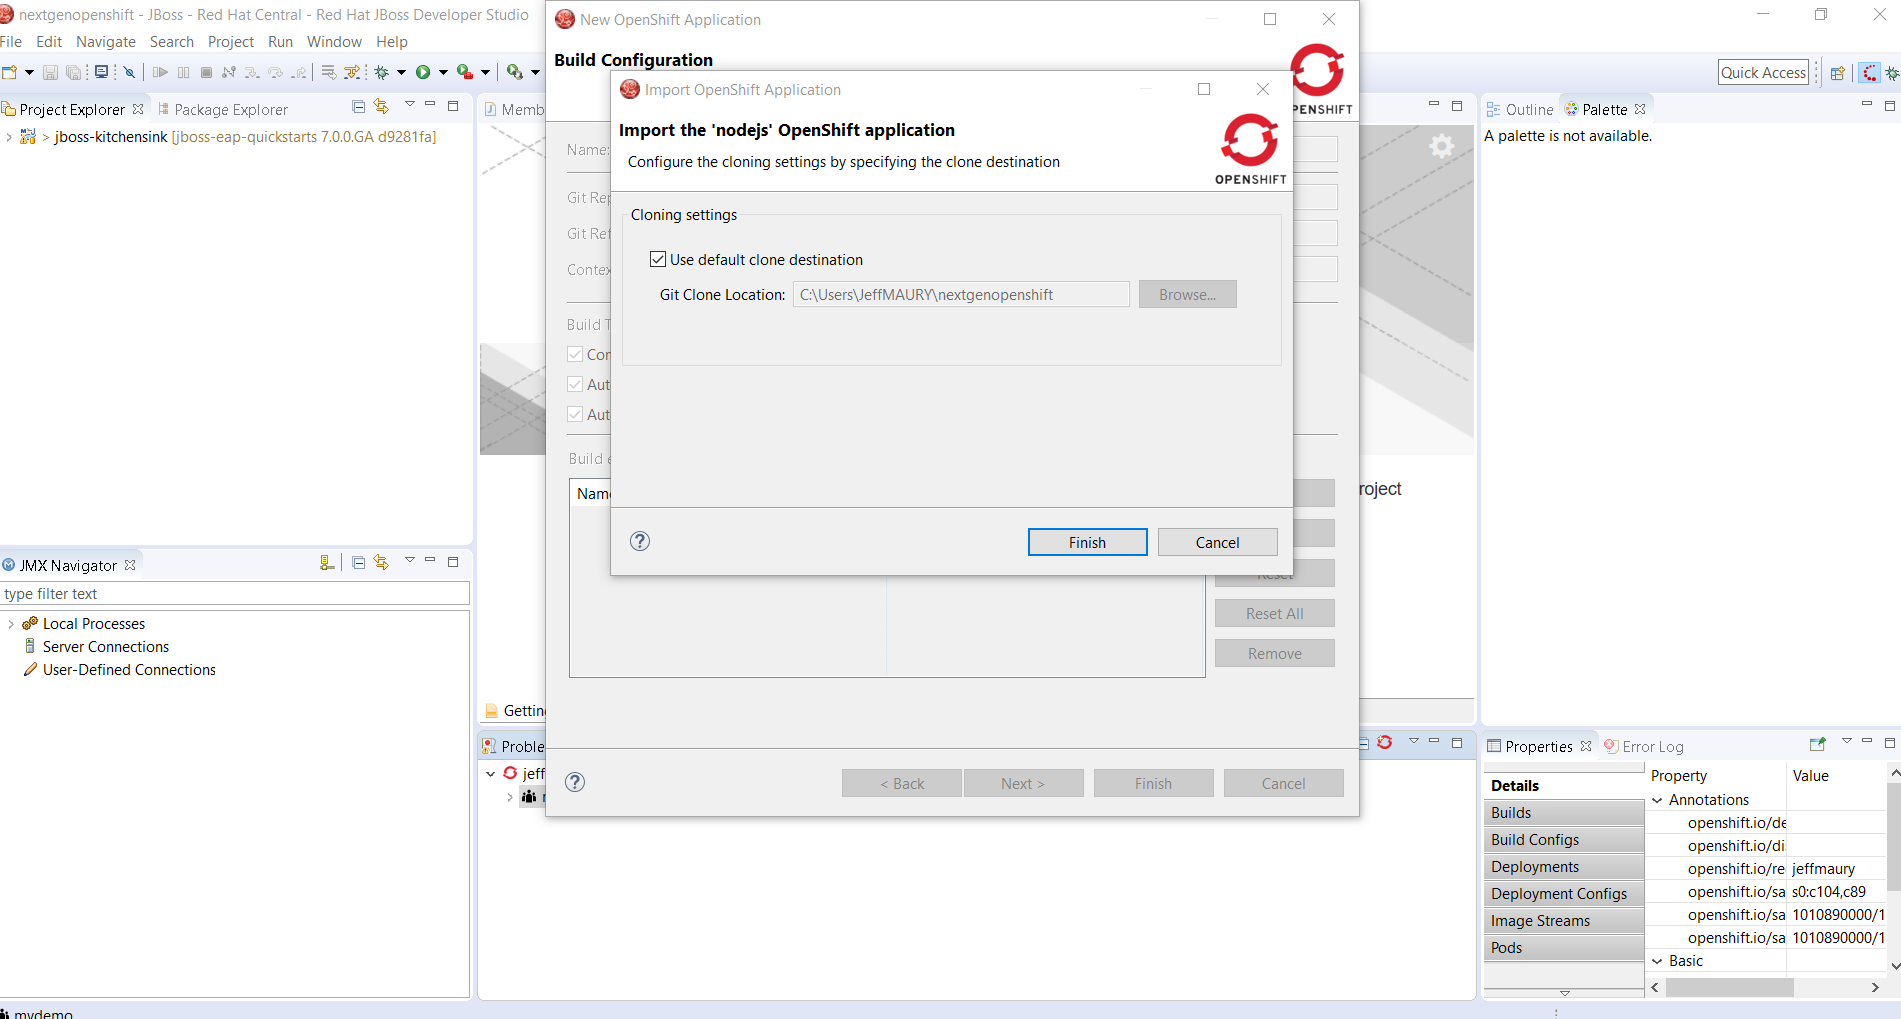
Click the Finish button. The source files for the application will be copied from the Github Git repository and a new project will be created in the local workspace:
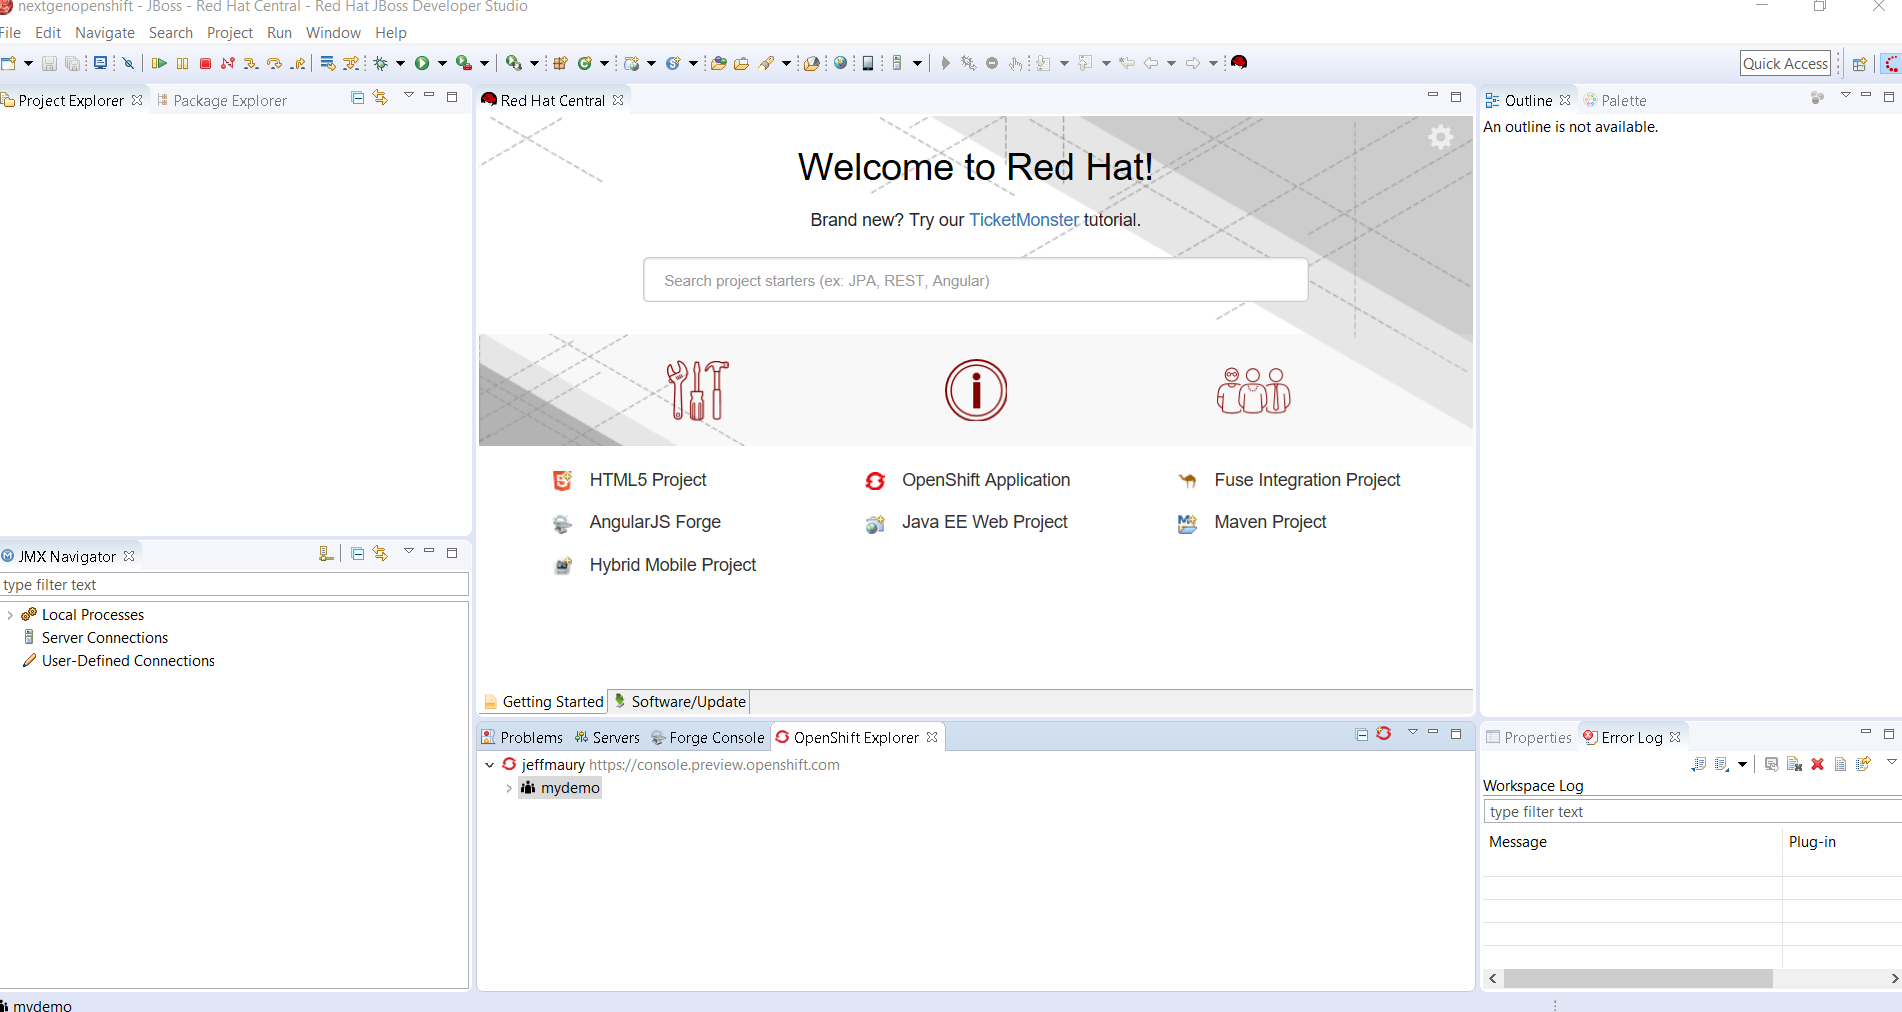
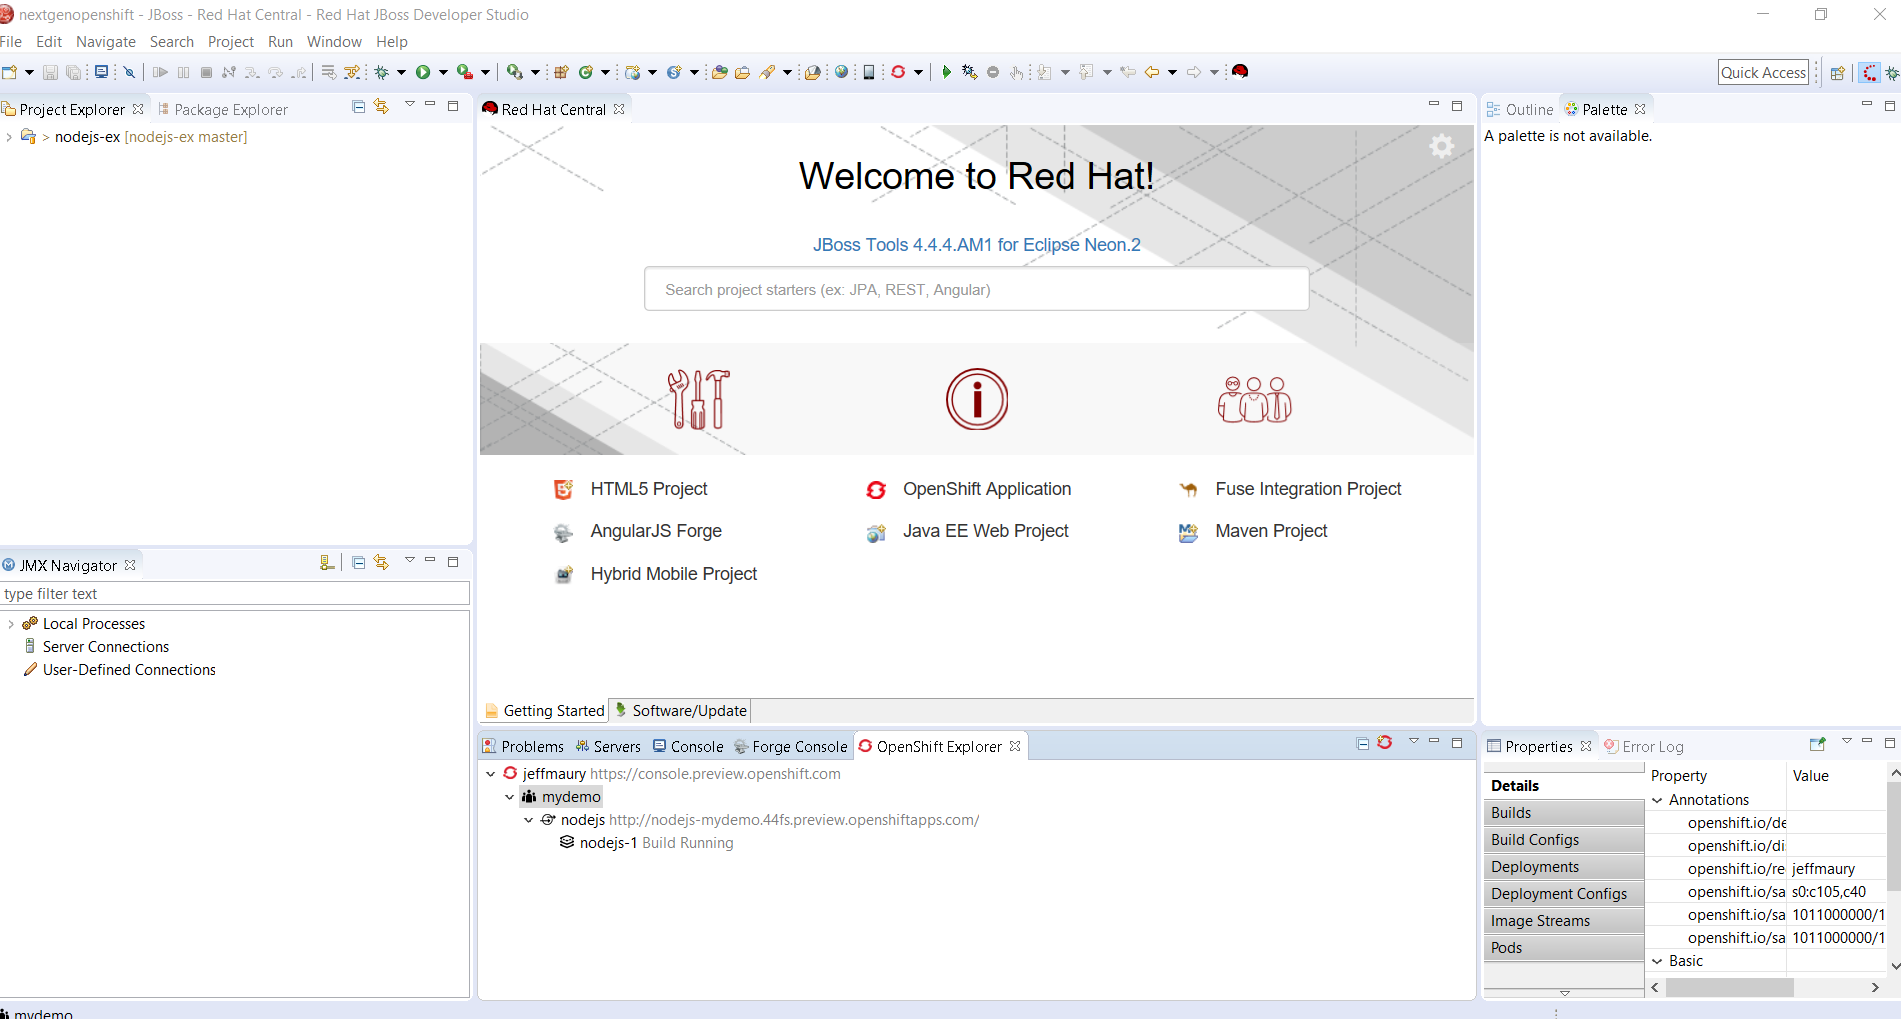
If you unfold the 'mydemo' project in the OpenShift Explorer view, you should see something like:
If you don't see the 'nodejs-1 Build Running' item, then this means that the build has run and this item should have been replaced by the application one. It's very unlikely as resources are constrained on OpenShift Next-Gen and the build took around 2 minutes to complete when writing this article.
When the build is finished, the OpenShift Explorer view will be updated and will look like:

The name of the leaf item is dynamically generated but should follow the pattern: nodejs-1-suffix.
Checking the deployment
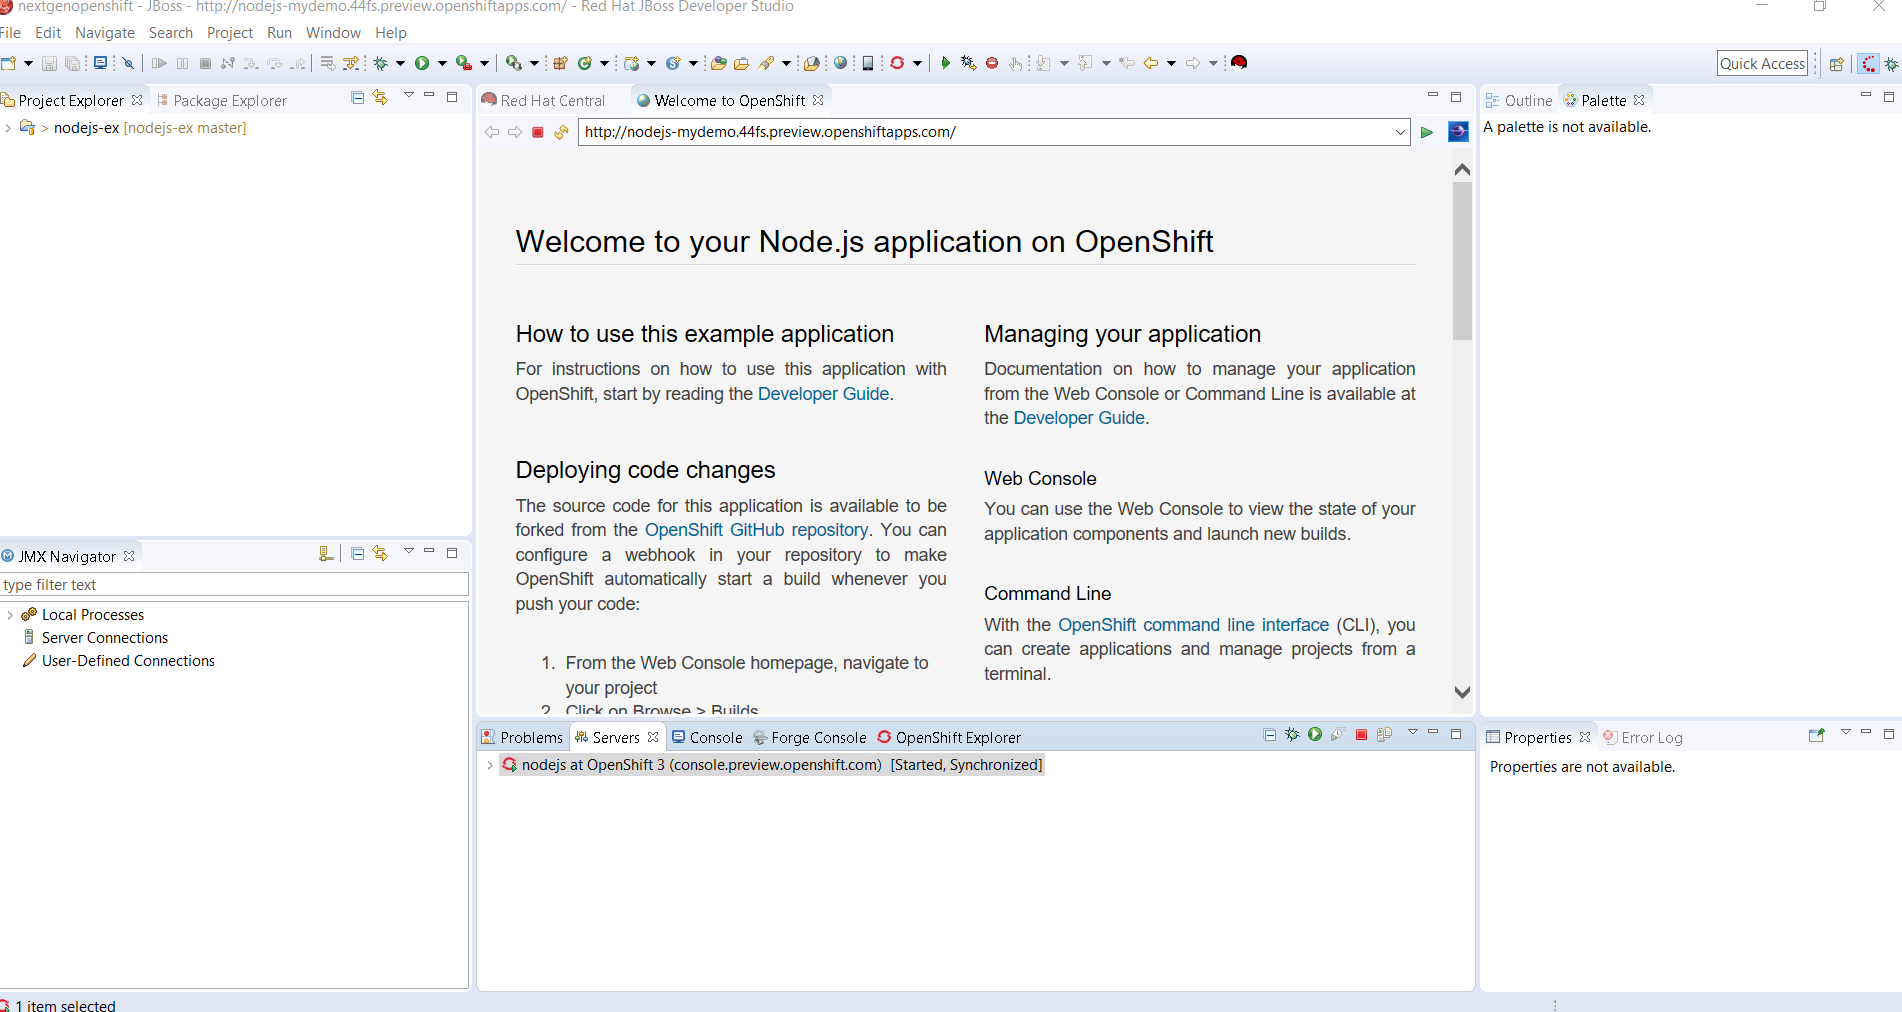
Let's access the application now. Right click the 'nodejs' item, and select the 'Show In -> Web Browser' menu item. A new browser window will be opened and you should see the following content:
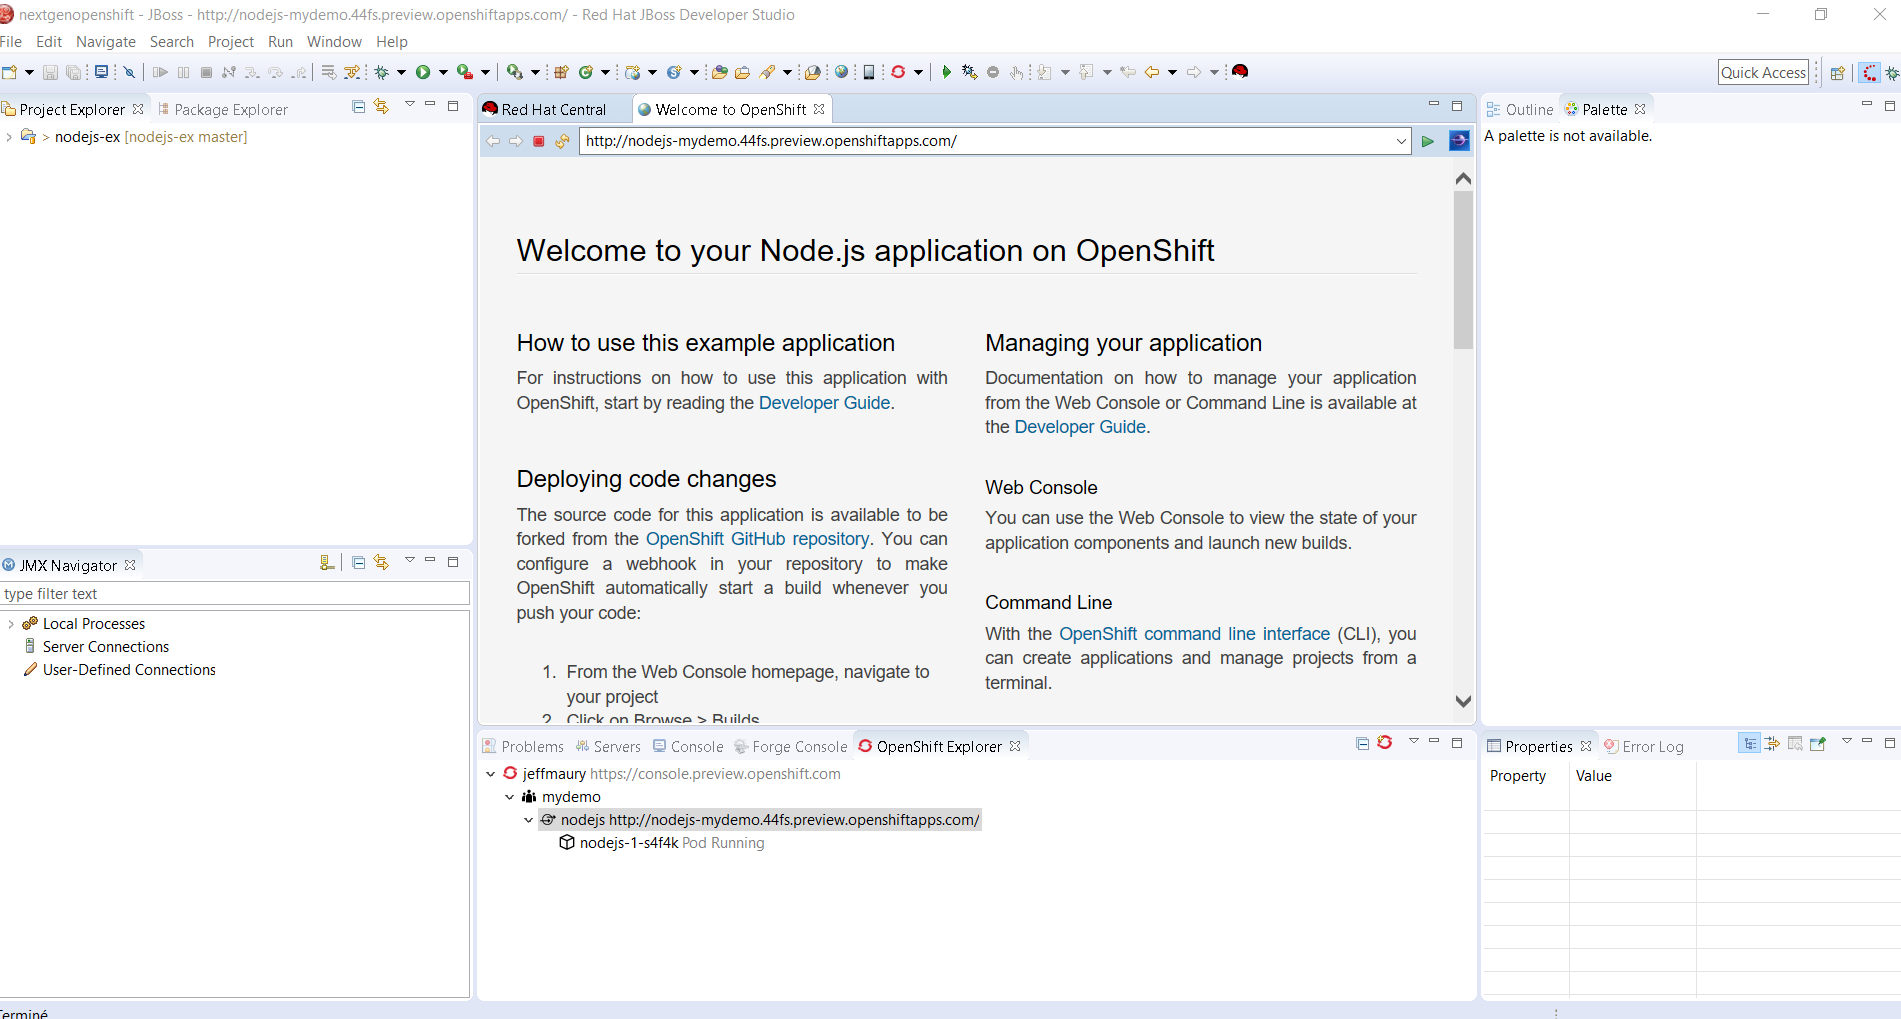
If you can see this, then the application has been successfully deployed on the OpenShift Next-Gen platform. We are now ready to switch to the next phase, debugging.
Debugging the NodeJS based application
Before we go deeper, let's explain where we are. We've deployed an application on the OpenShift Next-Gen platform, and we also have downloaded the application source files in our local workspace.
Red Hat JBoss Developer Studio will allow the same user experience for developers when dealing with cloud-oriented applications than for local applications: a local change to an application source file should be available without restarting the application, and debugging the application code should be allowed even if the application is running on the OpenShift Next-Gen platform.
Let's describe how it works:
Red Hat JBoss Developer Studio provides a tool called the OpenShift server adapter that acts as a synchronization tool between a local Eclipse project and an OpenShift deployment (it can be a service, a deployment config or a replication controller).
It can run in two different modes:
- run: this is the base mode. It offers changes synchronization between the local Eclipse project and the OpenShift deployment. Each time a modified file is detected on the local project, the changes are sent to the OpenShift pods. The file can be a JavaScript file that will be sent so that the new code can be immediately checked. This can be also an .html file (presentation layer) so that the user interface can also be checked as well.
- debug mode: this is an advanced case where you have all the synchronization features of the run mode but in addition, the OpenShift deployment will be updated so that the remote NodeJS VM is now launched in debug mode and the local Eclipse will also start a remote JavaScript application configuration, which will be connected to the OpenShift pods of the OpenShift deployment. So, if you put breakpoints in files for the local Eclipse project, and if that specific line of code is executed on the remote OpenShift platform, then your local Eclipse will stop execution and display the debugged file! Isn't it amazing?
So now that we have an OpenShift deployment available and the corresponding source files in our Eclipse workspace, let's play!
Creating the OpenShift server adapter
In order to create the OpenShift server adapter, you need a running deployment and a local Eclipse workspace. As we have one and we downloaded the application source files, this will be easy for us.
In the OpenShift Explorer view, select the 'nodejs' node, right-click and select the 'Server Adapter...' menu item. A new wizard will be displayed:
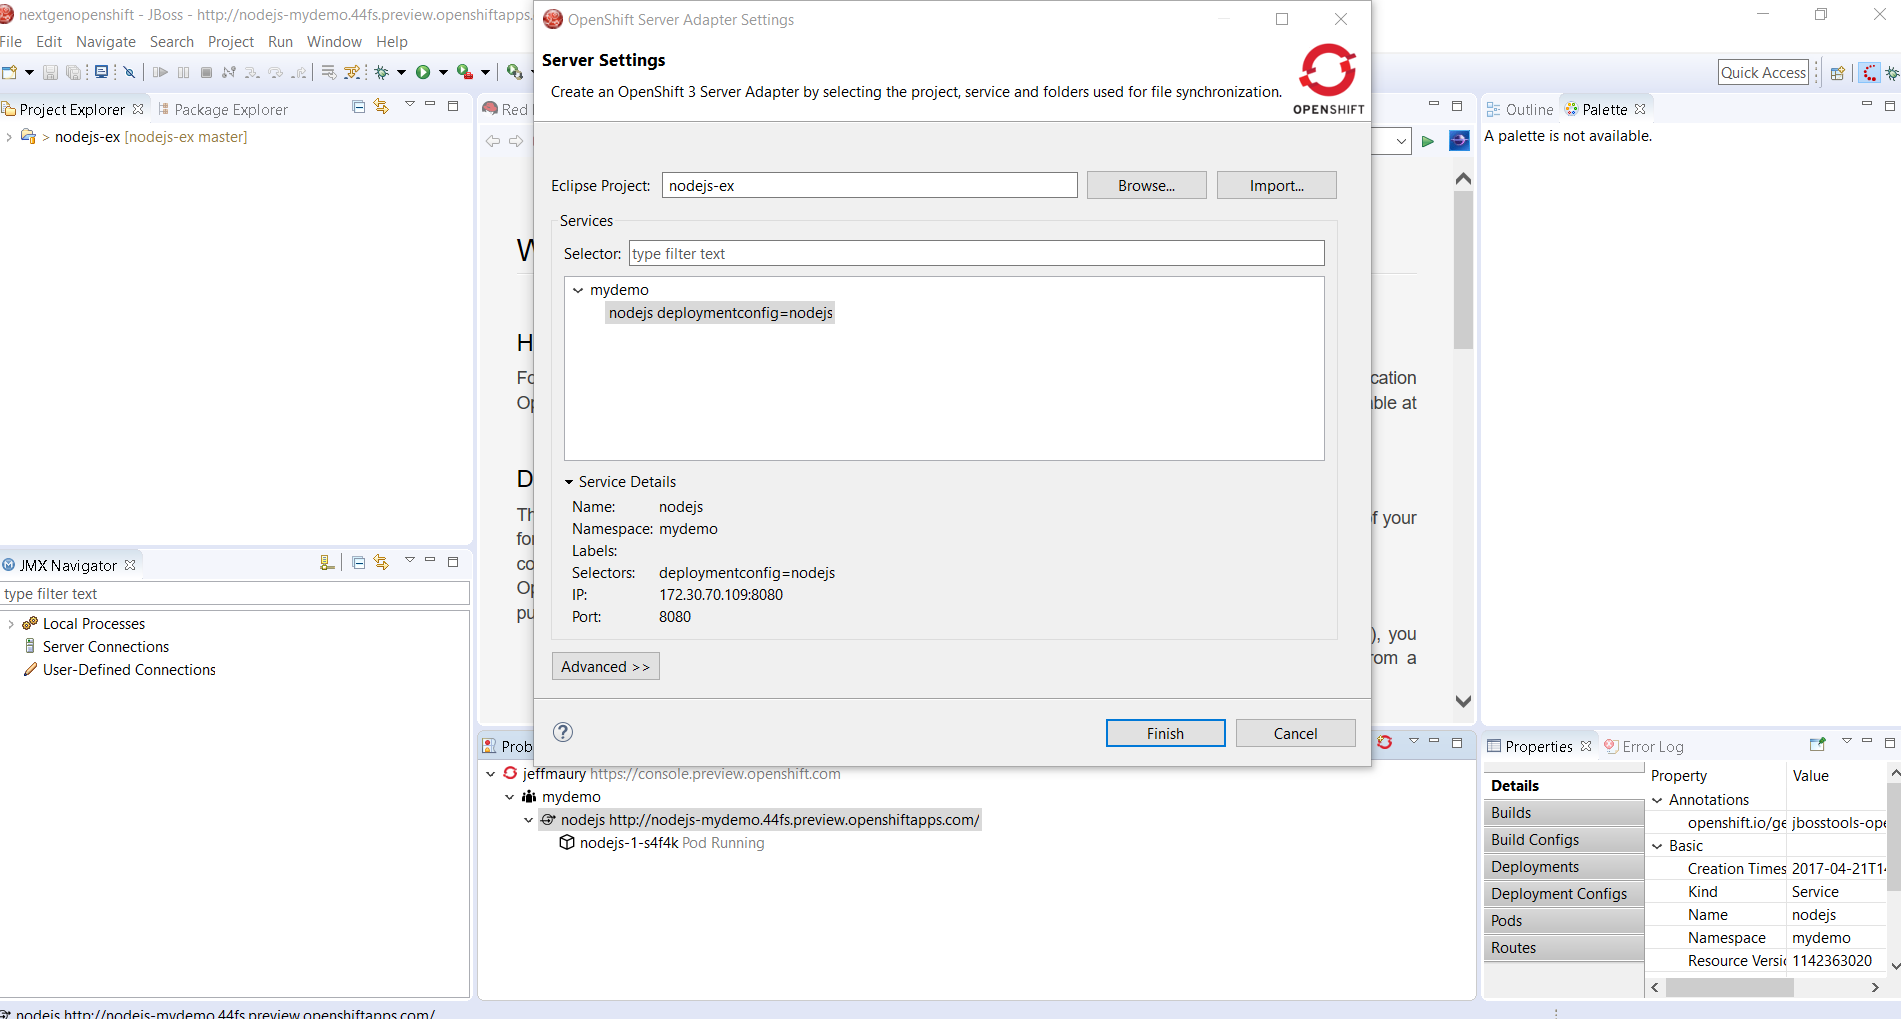
You should select the local Eclipse project that will be synchronized with the OpenShift deployment and the OpenShift deployment. As we have a single Eclipse project in our workspace and a single OpenShift deployment, they will be automatically selected and you can use the defaults so click the 'Finish' button.
First, the Servers view will be automatically displayed and the newly created server will be added to the view. Then the Console view will be displayed and you're going to see messages displayed there: this is the synchronization process that has been initiated to make sure the local Eclipse project is up to date with the OpenShift deployment:
Update the application files and see the changes propagated live
In this scenario, we will modify the welcome page of the application and check that change has been propagated to the OpenShift deployment.
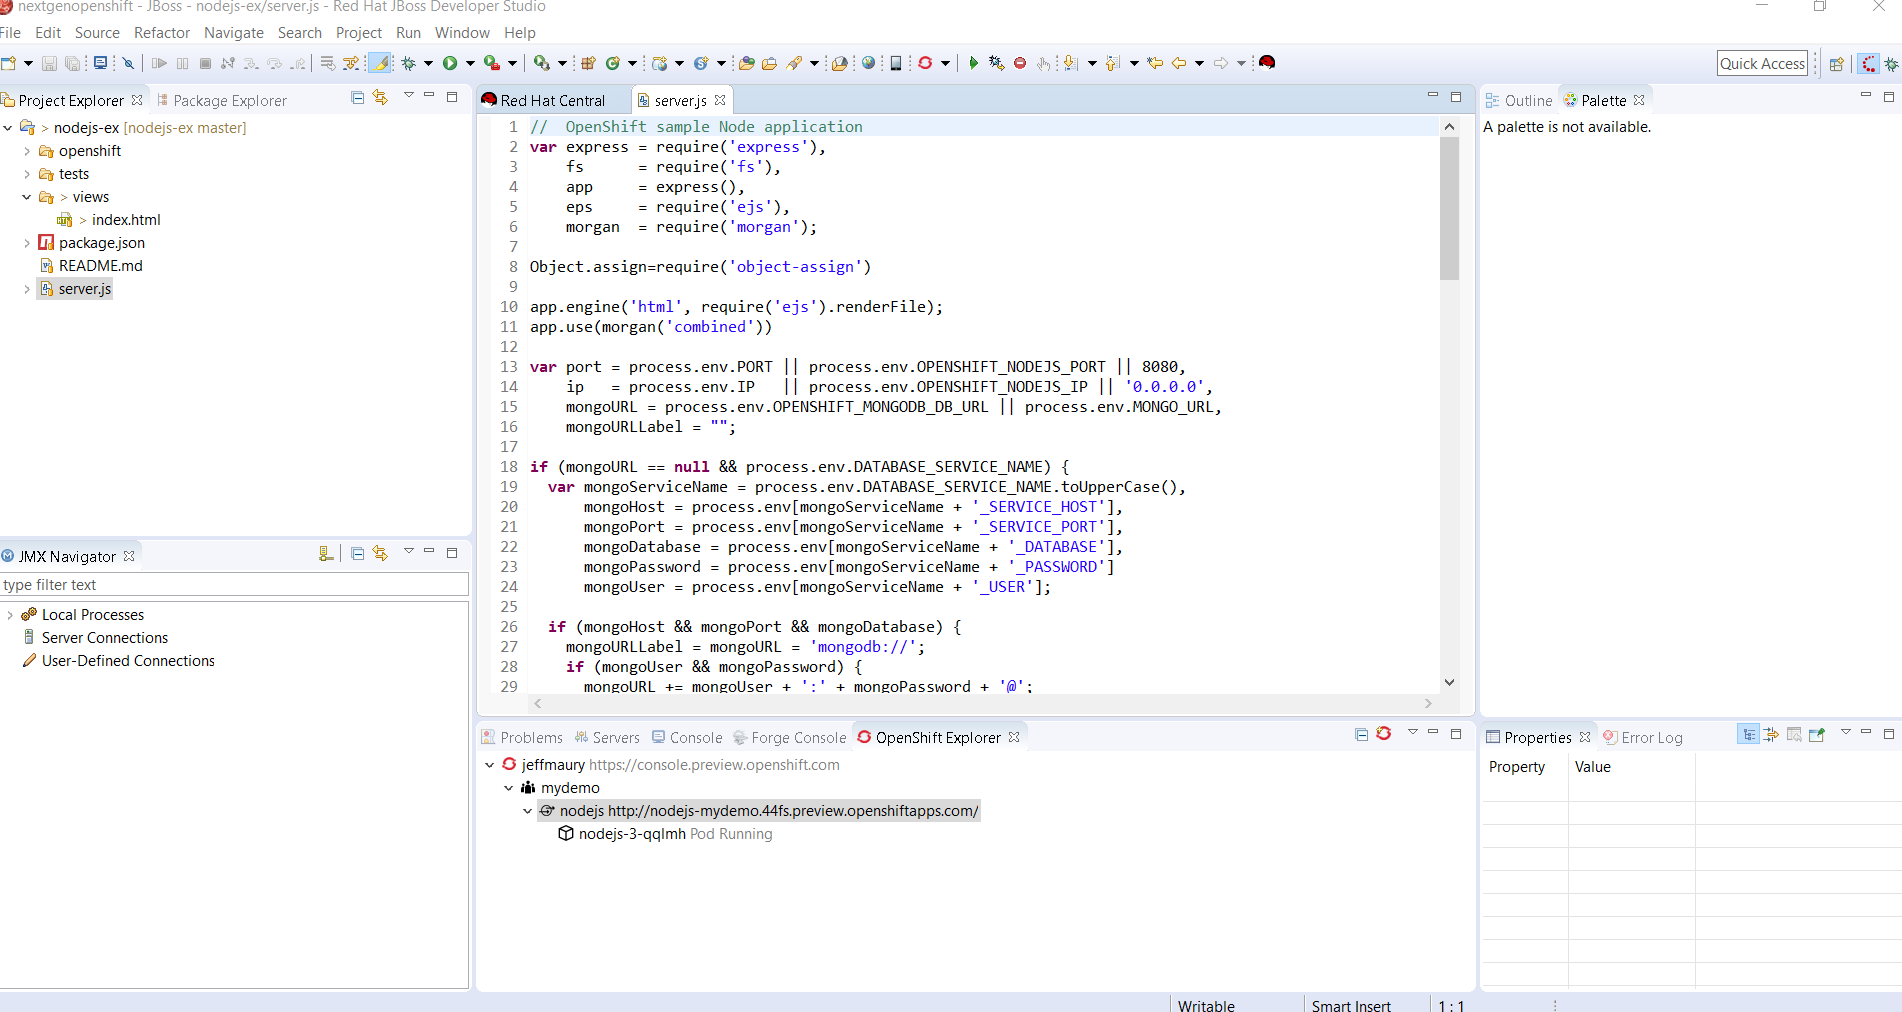
In the Project Explorer view, unfold the 'nodejs-ex' project, under that project, unfold the views node and double click the index.html file:
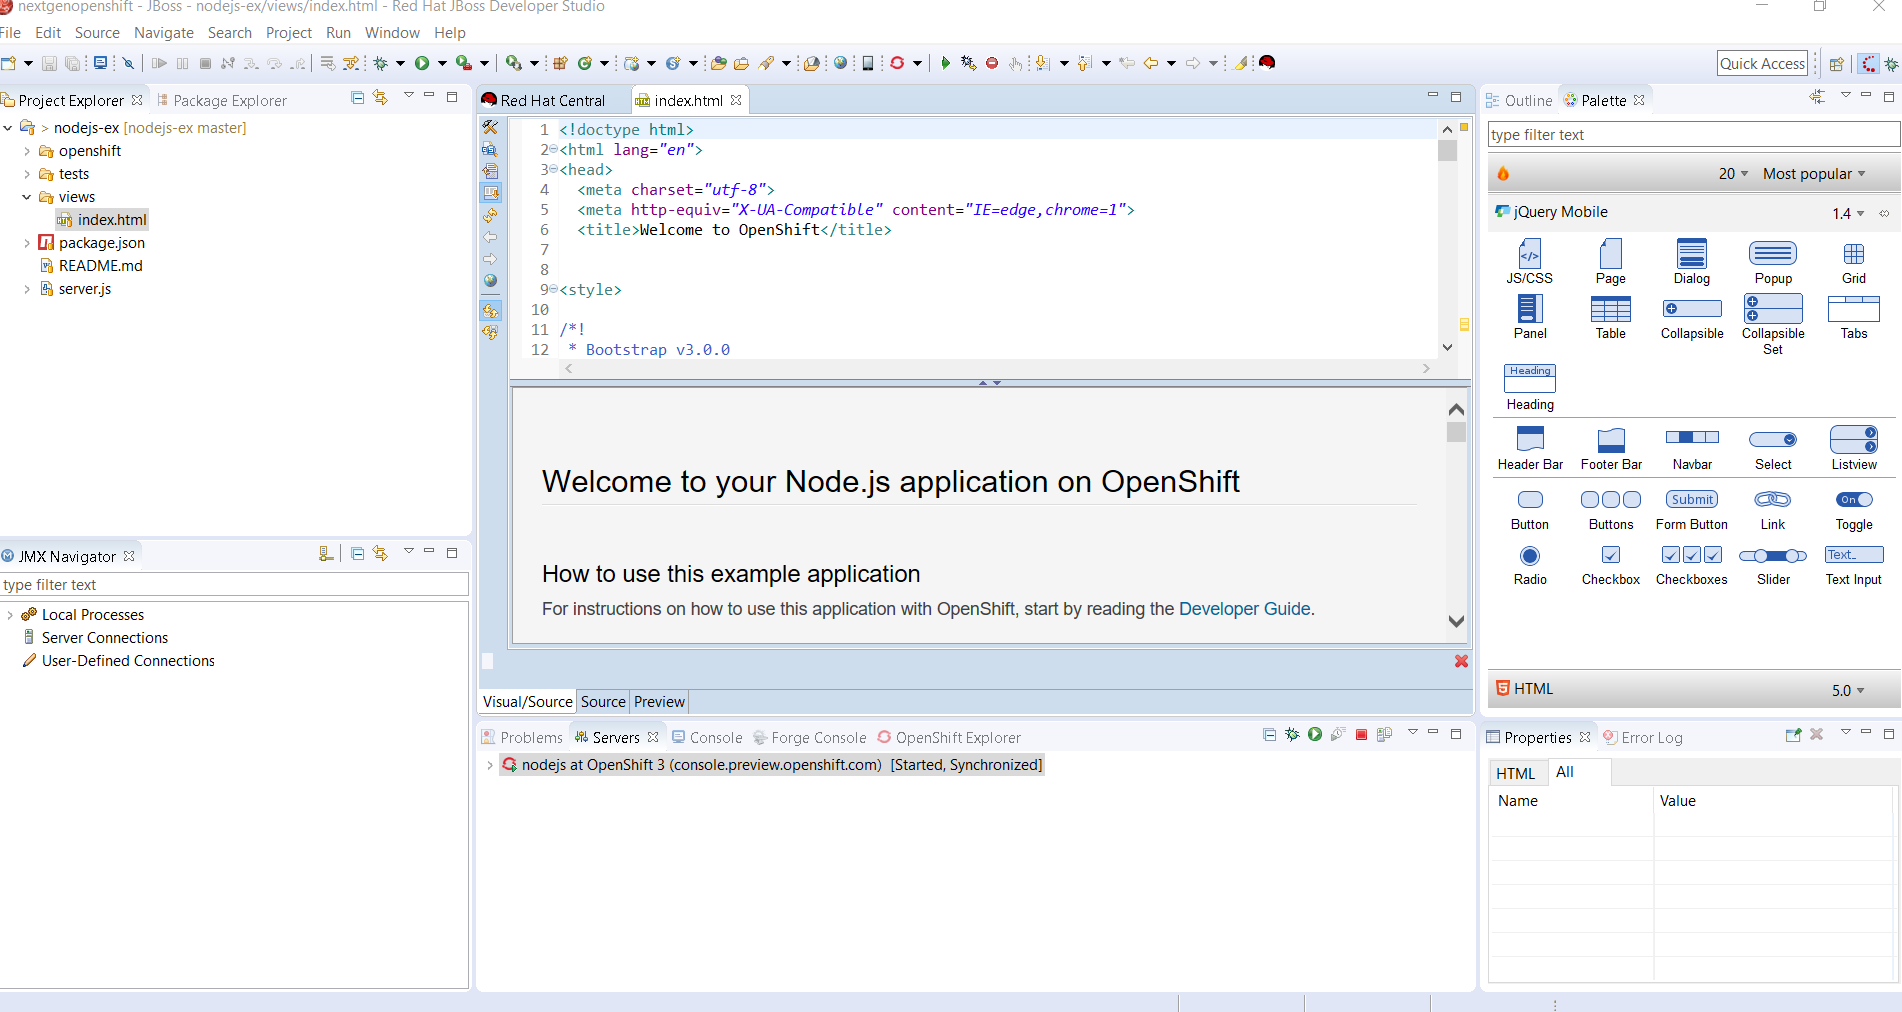
If you scrolled down a few lines, you should see the following line:
<h1>Welcome to your Node.js application on OpenShift</h1>
Replace it with the following content:
<h1>Welcome to your Node.js application on OpenShift from Red Hat JBoss Developer Studio</h1>
save and close the editor (Ctrl + W).
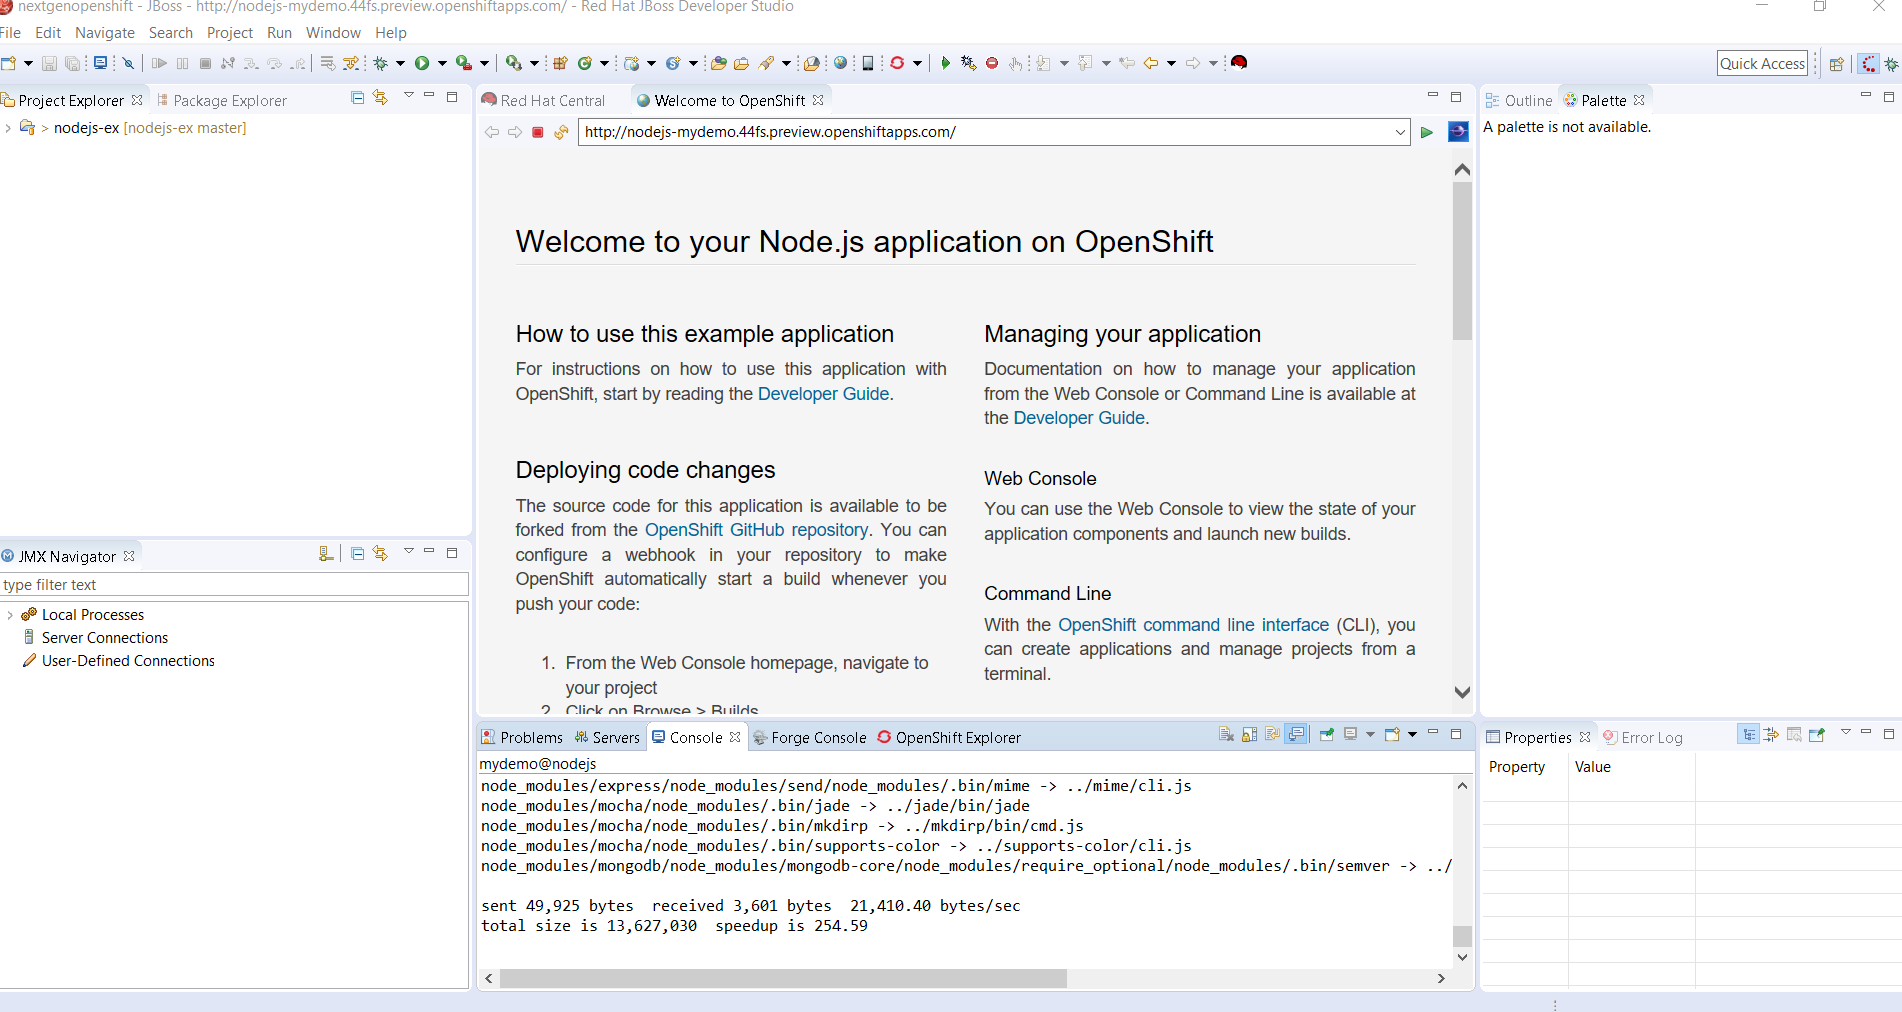
You should see some messages in the 'Console' view: changes are propagated to the OpenShift deployment.
Let's check that this is real!
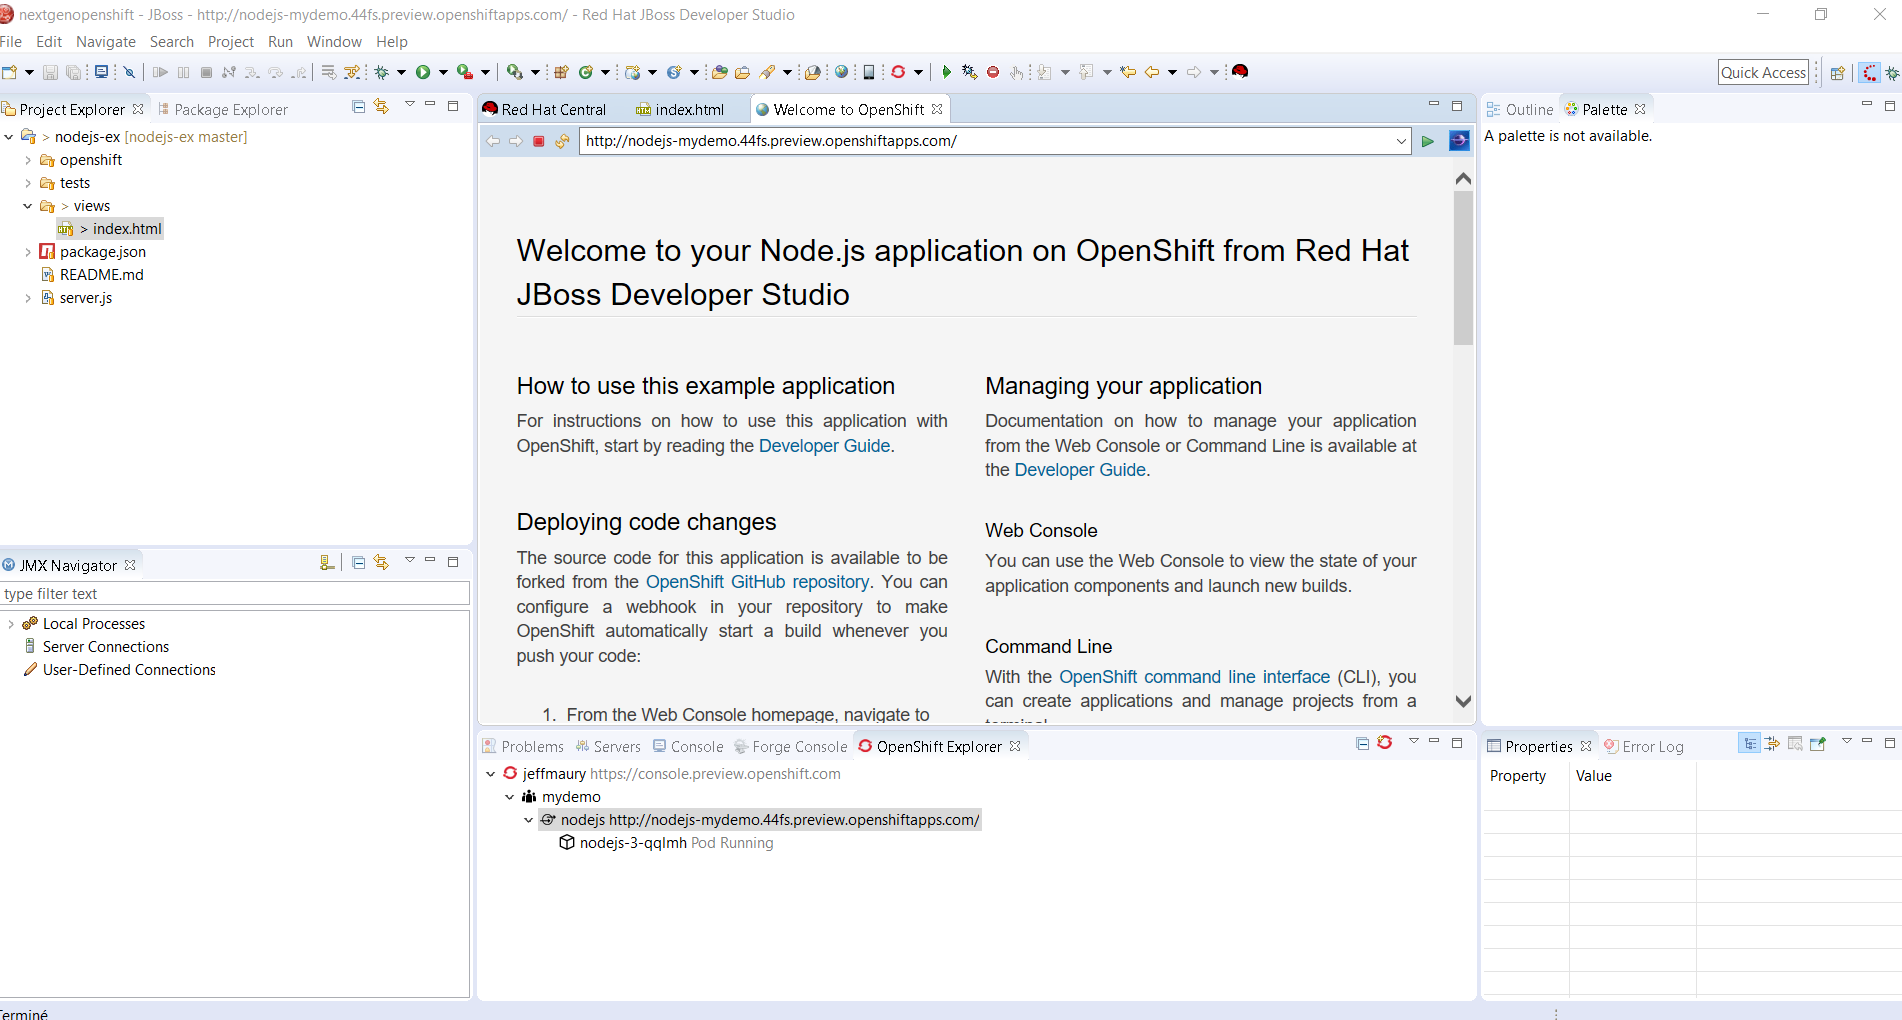
In the OpenShift explorer view, select the 'nodejs' item, right click and select the 'Show In -> Browser' menu item. A new browser window will be displayed with the following content:
So, it seems something is wrong because we can't see the modifications we've just done to the file. The reason is that the NodeJS VM needs to be launched in a special mode (called the dev_mode) in order for the local file changes to be loaded on the fly. As when we created the deployment, by default, this mode is not activated (this will be fixed in Red Hat JBoss Developer Studio 10.4, when the server adapter will be launched in run mode, it will check if the flag is enabled on the deployment configuration and if not, it will update the deployment configuration so that the flag is on).
But we have a workaround for that. When the server adapter is launched in debug mode, this flag is enabled so if we restart the server adapter in debug mode, we should see the changes.
Debugging the application
The first step to follow is to have our deployment switch to debug mode. This is simply done by restarting the server adapter we've just created in debug mode (it should be called nodejs at OpenShift 3 (console.preview.openshift.com)). Select the Servers view, and then select the OpenShift server adapter we've just created, right-click and select the 'Restart in Debug' menu item. You will see some synchronization messages again in the Console view, but if you switch back to the Servers view, the status of the OpenShift server adapter should be updated to [Debugging, Synchronized]. Please note that due to OpenShift Next-Gen constraints, this can be a long-standing operation so be patient:
So, now let's re-open the browser to see the changes: in the OpenShift explorer view, select the 'nodejs' item, right click and select the 'Show In -> Browser' menu item. A new browser window will be displayed with the following content:
Next, we need to set a breakpoint in the application code. As the application is based on a single JavaScript file that acts as the main controller, we will set a breakpoint where the home page request is processed.
In the Project Explorer view, unfold the 'nodejs-ex' project, under that project, double click the server.js file:
If you scrolled down a little, you can see the whole content of the home route handler:
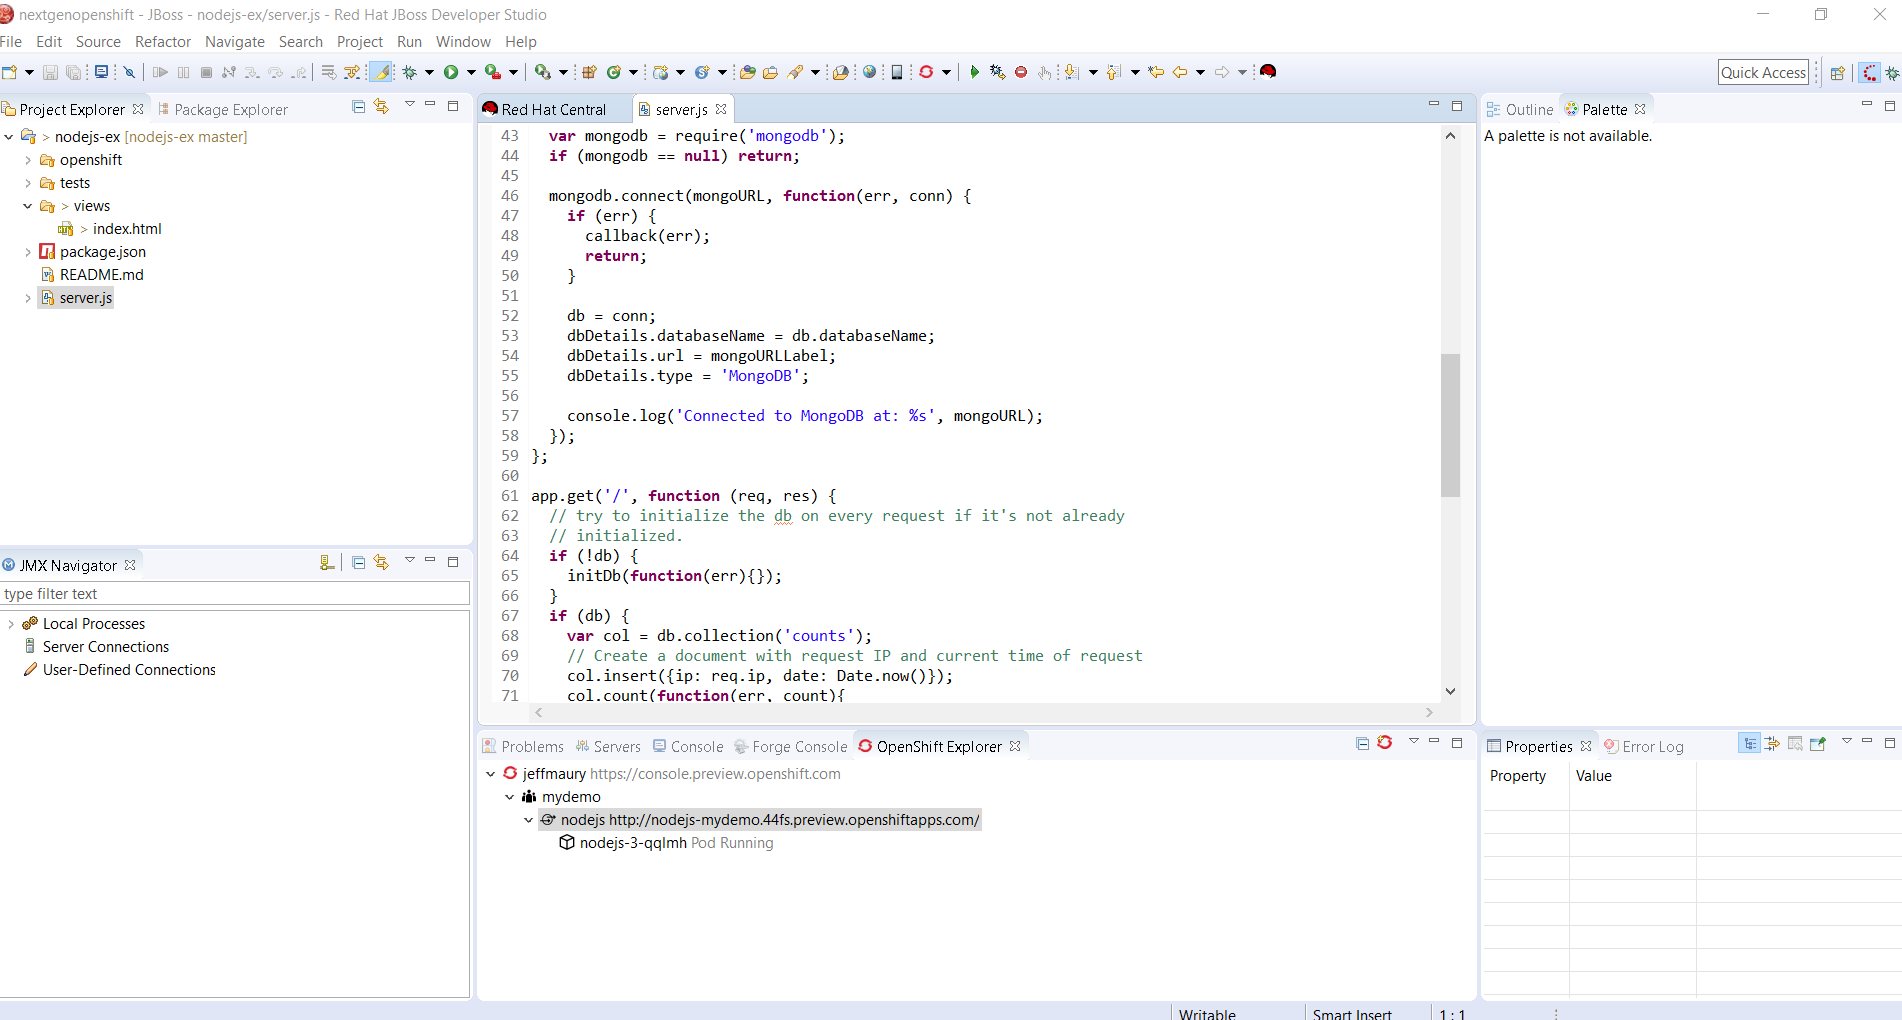
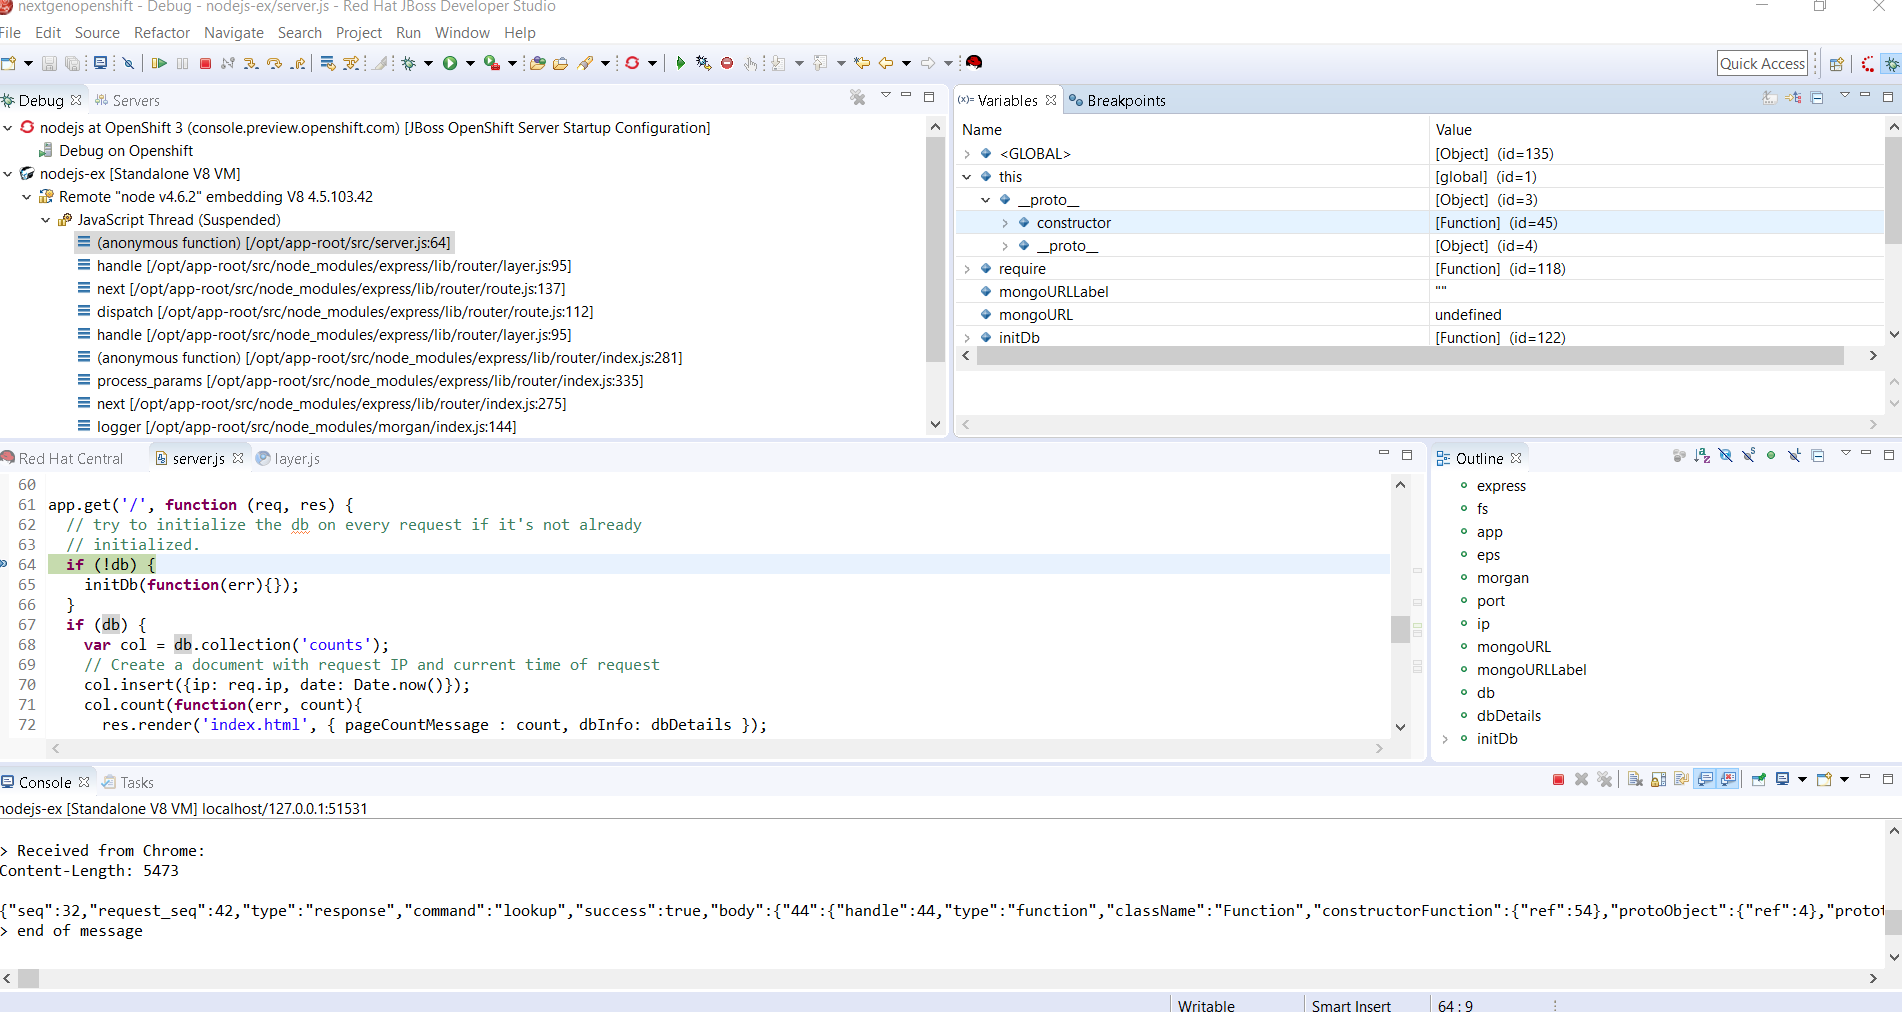
Let's put a breakpoint on the first line of code of this method: this should be line 64, the code should be:
if (!db) {
Double click on the left ruler, next to the 64-line number, the breakpoint will be set and a little blue balloon will appear:

We're now all set. We have our deployment running in debug mode thanks to the OpenShift server adapter restarting in debug mode and we set a breakpoint in the application code. We need now to reach that line of code so we need to launch the application user interface for that.
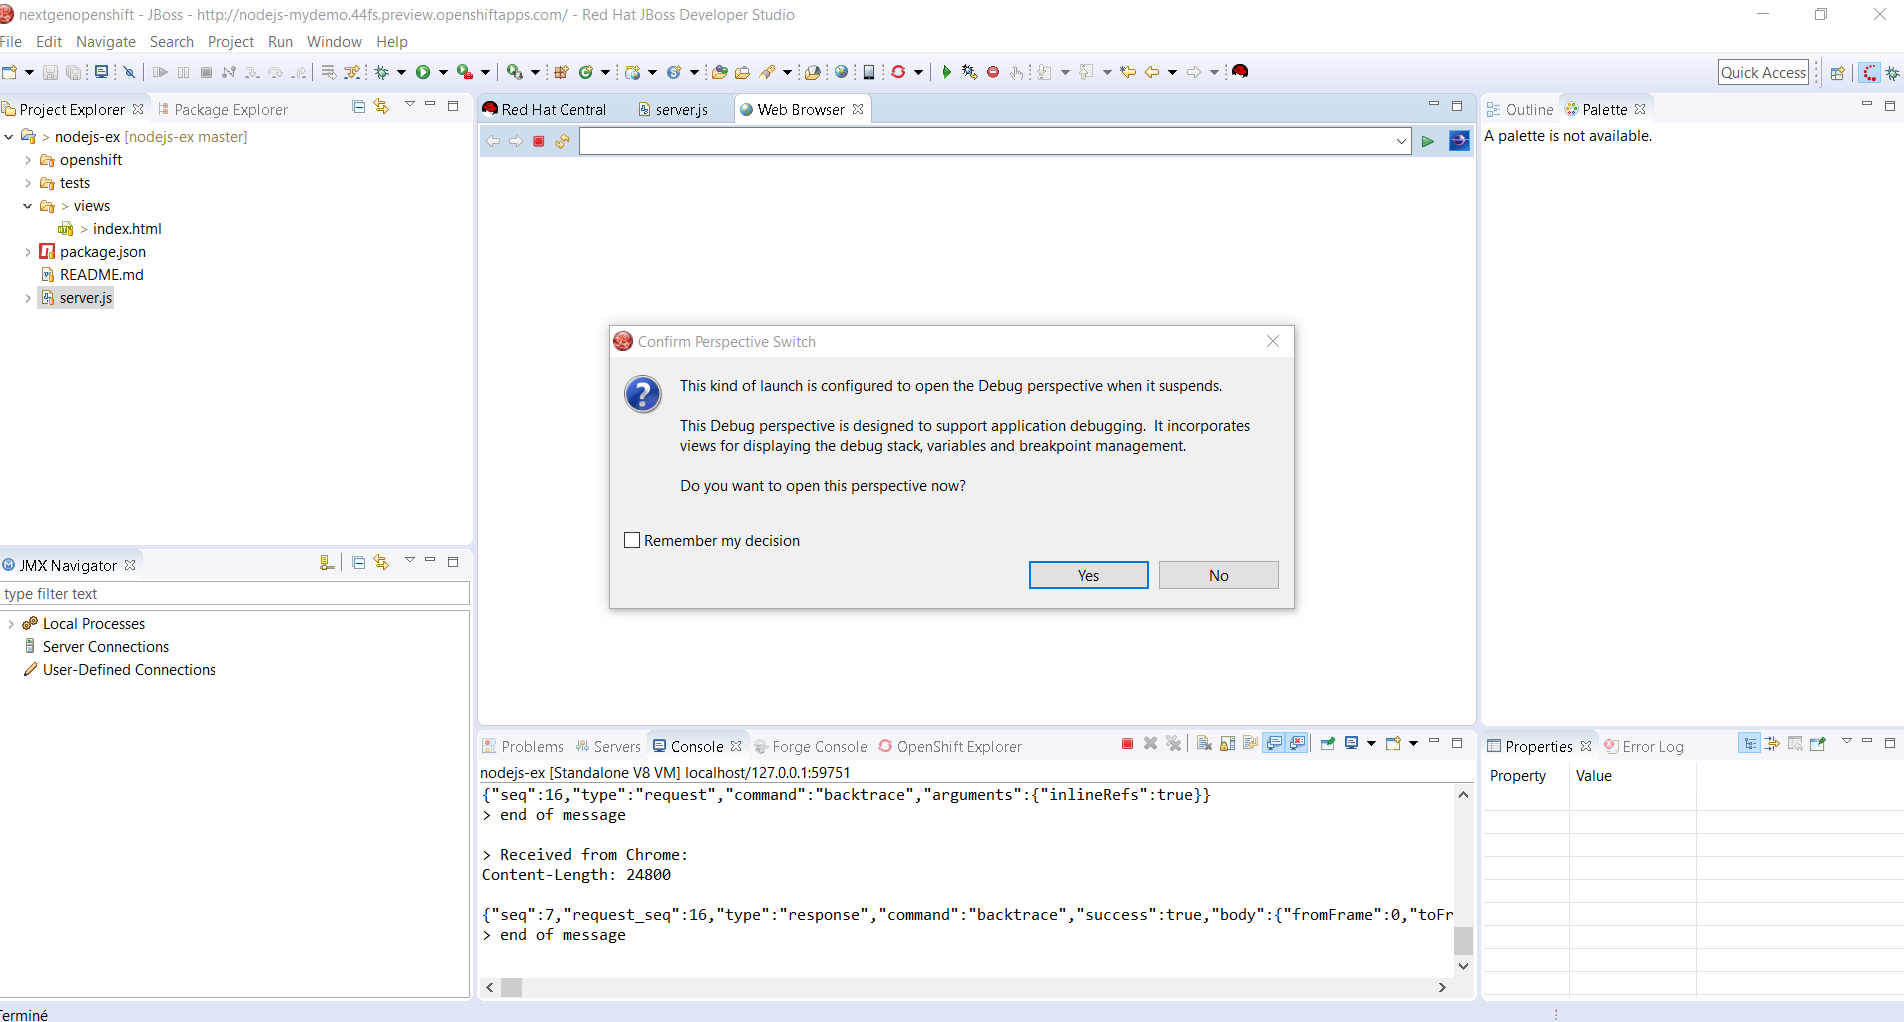
So, as we did previously, go back to the OpenShift Explorer view, select the 'nodejs' node, right click it and select the 'Show In -> Web Browser' menu item and the application user interface will be displayed in a new browser window.
If this is the first time you debug an application or if your workspace is new, you will see a dialog box asking you to switch to the Debug perspective. Click the Yes button. Otherwise, you will be driven automatically to the Debug perspective:
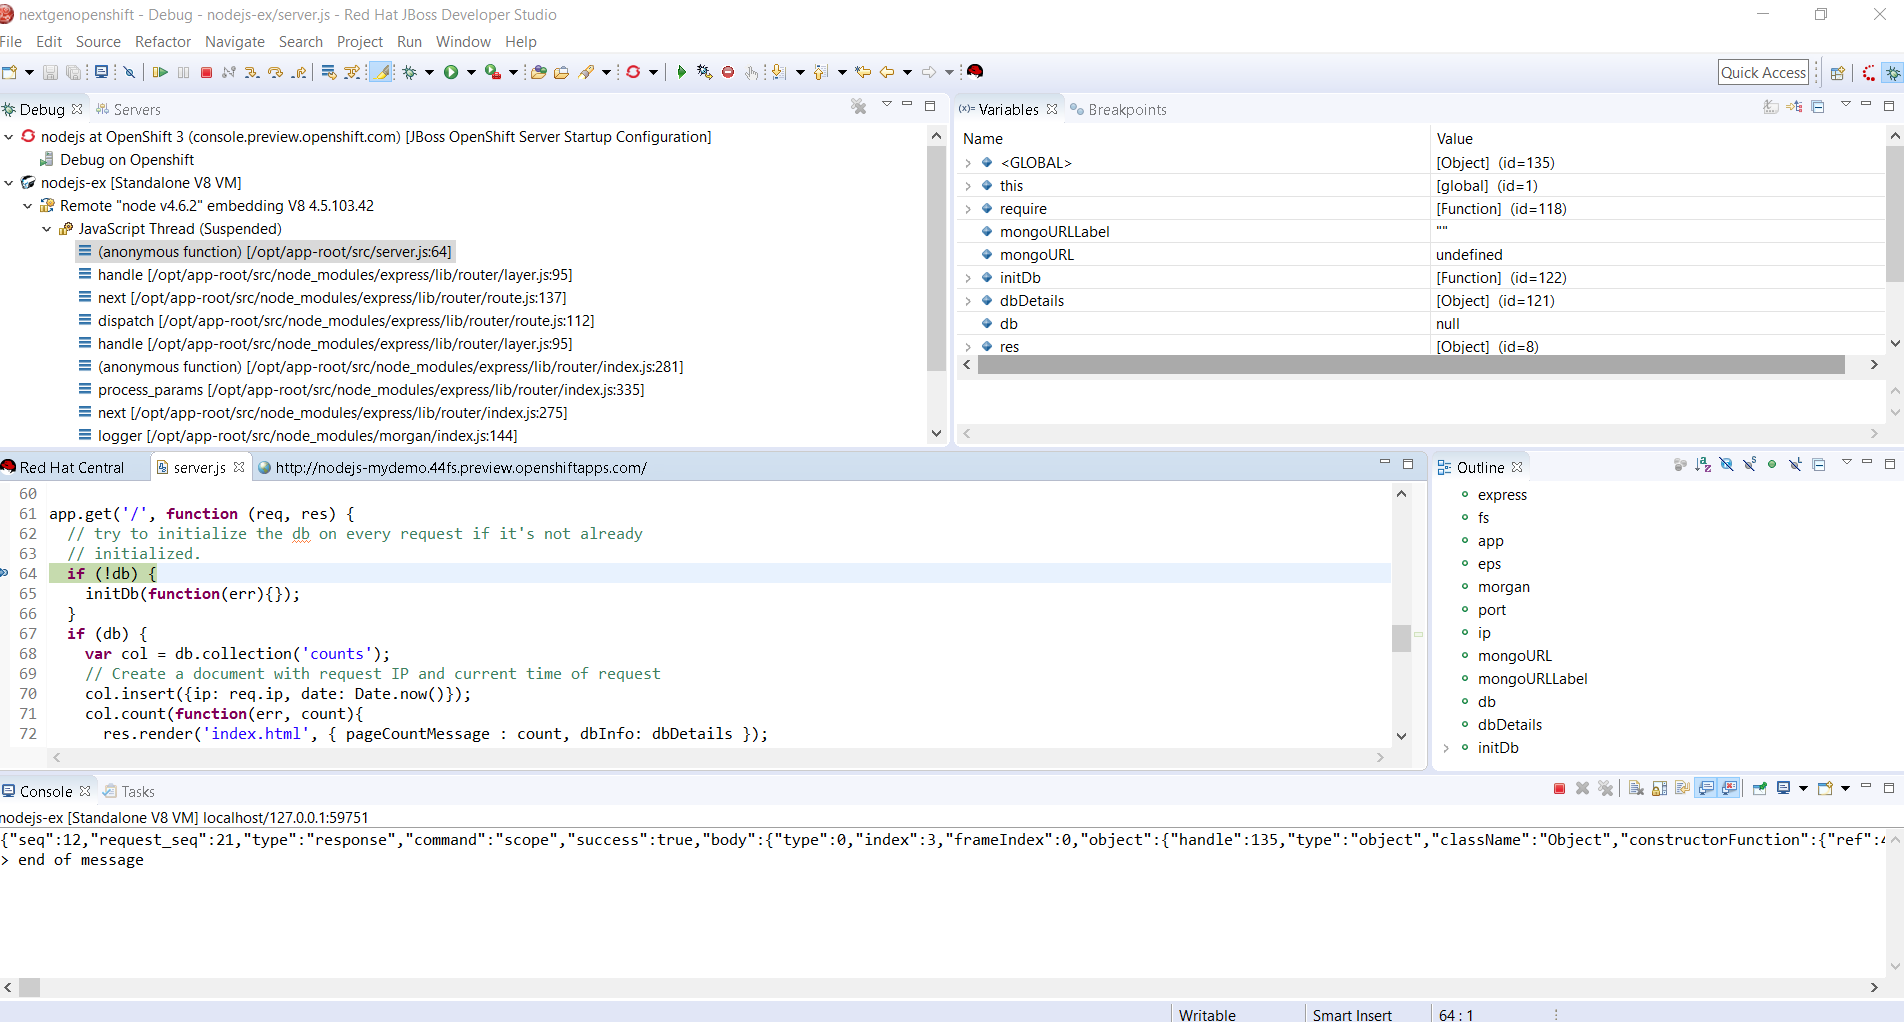
We did it. We reached the breakpoint and if you unfold the 'this' variable in the Variables view, you should see the values that you submitted:
Then you can step (in or out) in the code just like with a local JavaScript application.
So, you've now just discovered how trivial it was to debug a remotely deployed NodeJS application.
Develop and Deploy on OpenShift Next-Gen using Red Hat JBoss Developer Studio (Part 1)
Red Hat JBoss Developer Studio is available for download, install it today.
Last updated: November 9, 2023