vLLM is the leading open source inference and serving engine for LLMs. Averaging 64 commits a day with bi-weekly releases, the open source project goes through a significant amount of code changes rapidly. Red Hat AI Inference offers an integrated inference platform powered by vLLM, llm-d and vLLM's llm-compressor. It's the enterprise version of these open source capabilities rebuilt from source, and packaged for enterprise reliability and scale.
Now imagine you've added support for a highly requested model on Red Hat AI Inference.
The release day comes.
Latency increases, throughput drops.
And your customer is the first to notice.
Yet the code has passed every test. Somehow between the upstream open source and the downstream production image, performance serving has drastically fallen off and there was no automated system to catch this.
Most CI/CD pipelines tend to miss performance regressions until it's too late in production.
Midstream: The bridge from upstream to downstream
This is where the midstream team steps in.
Every new upstream vLLM release goes through a multi-stage process before it becomes a production Red Hat AI Inference image.
The team takes the upstream open source project and applies cherry-picks that didn't make it into the upstream release before packaging it all into container images for specific hardware (NVIDIA CUDA, AMD ROCm, Google TPU, and so on).
Model performance can be dependent on different base images. Every different dependency, base OS, and hardware variant can cause silent performance degradation.
To catch this, it's important to incorporate testing directly into the development process. During my 12 week internship with Red Hat AI Inference, I had the opportunity to build and integrate this regression testing into production automation.
The benchmark regression detector
The goal with my project is to compare the upstream to our midstream build through benchmarks and catch regression within CI/CD before release.
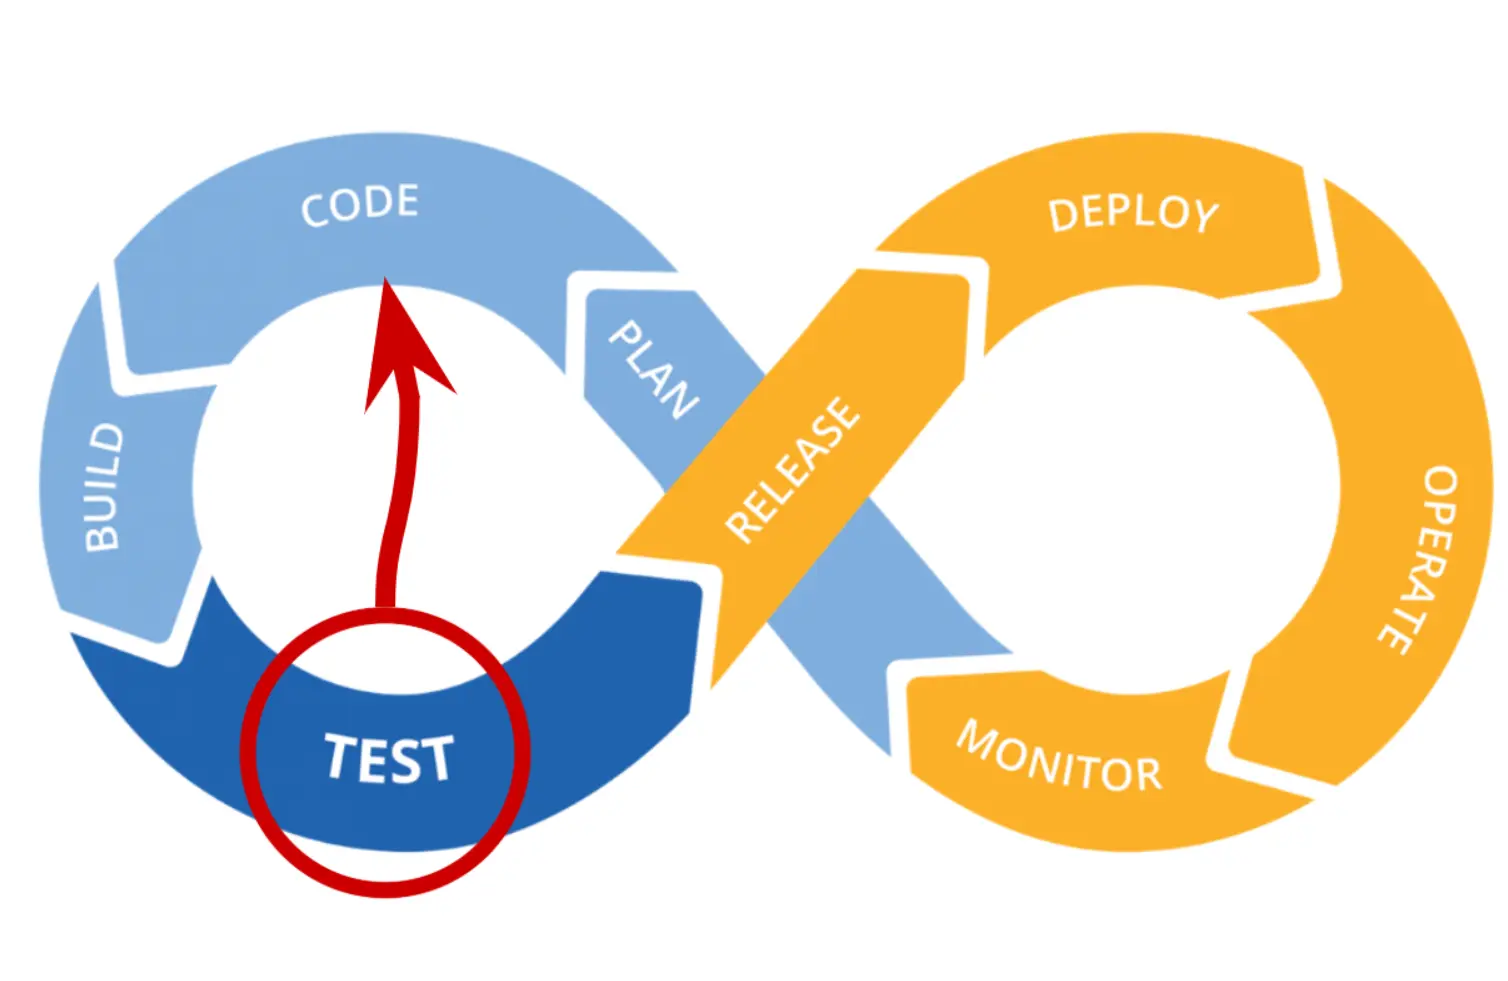
The process is simple: Benchmark both upstream and the midstream releases of models on the list of hardware, then compare them. If there's a regression, we work to find the specific issue and then rebuild and test again (figure 1).
There are 2 main areas we care about when benchmarking and evaluating LLMs: Performance and accuracy.
- Performance: Measures how fast our customers can serve LLMs. Important metrics include time to first token, throughput, and intertoken latency.
- Accuracy: Are LLM responses as expected? Specifically, we measure how high we can score on specific tasks, such as math tests like GSM8K or AIME (the full suite of evaluation is, of course, open source).
For the detector specifically, we benchmarked using GuideLLM (part of the vLLM project) across various concurrency levels for performance and tasked GSM8K on models for accuracy.
Our workflow
First, a nightly upstream scanner checks for new upstream vLLM releases, and then benchmarks the models across different hardware. The results are stored on cloud storage, which will later be used to compare for regressions.
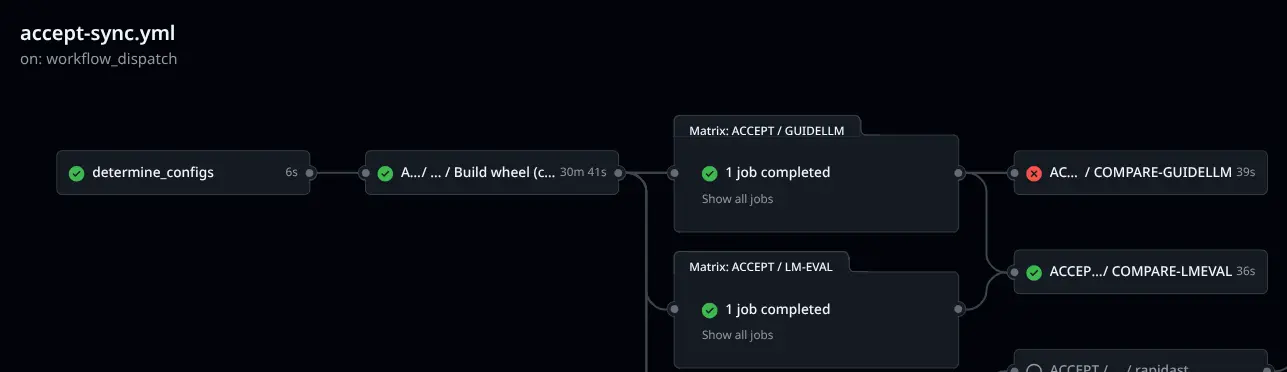
After the midstream team finishes their changes for the Red Hat AI Inference release, they run their build and benchmarks for the release candidate. Following the benchmarks, the workflow compares the midstream benchmarks to the stored upstream results (figure 2).
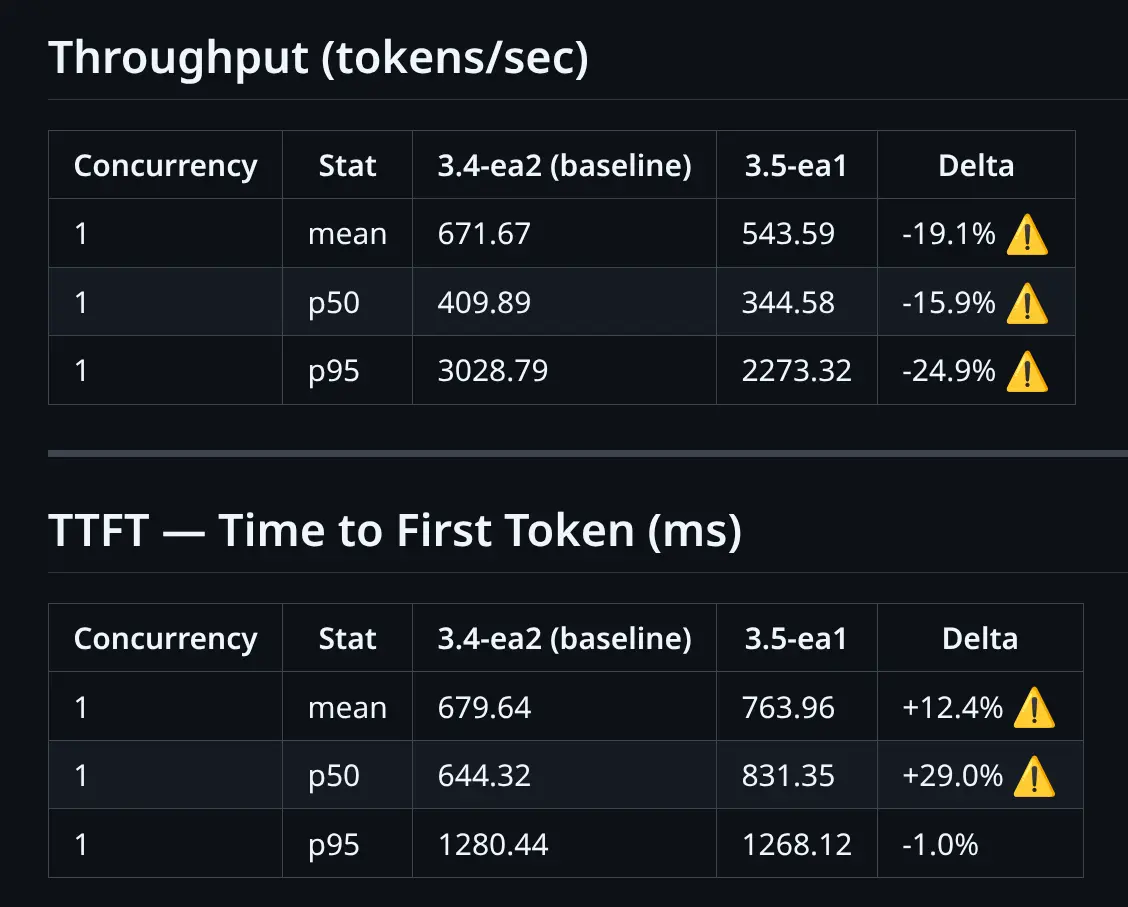
When comparing the models, we set a threshold delta (the maximum difference) that the benchmark scores must fall within. If the performance isn't within that threshold, then flag it (figure 3).
If it's a real regression, then we identify the issue and rebuild with the fix and run this process again until ready for release.
Tools I used
For diagnosing issues, I created an agent skill connected to the benchmark run and JIRA tickets of prior regressions (figure 4). The goal was to suggest fixes and the likelihood of a real regression.
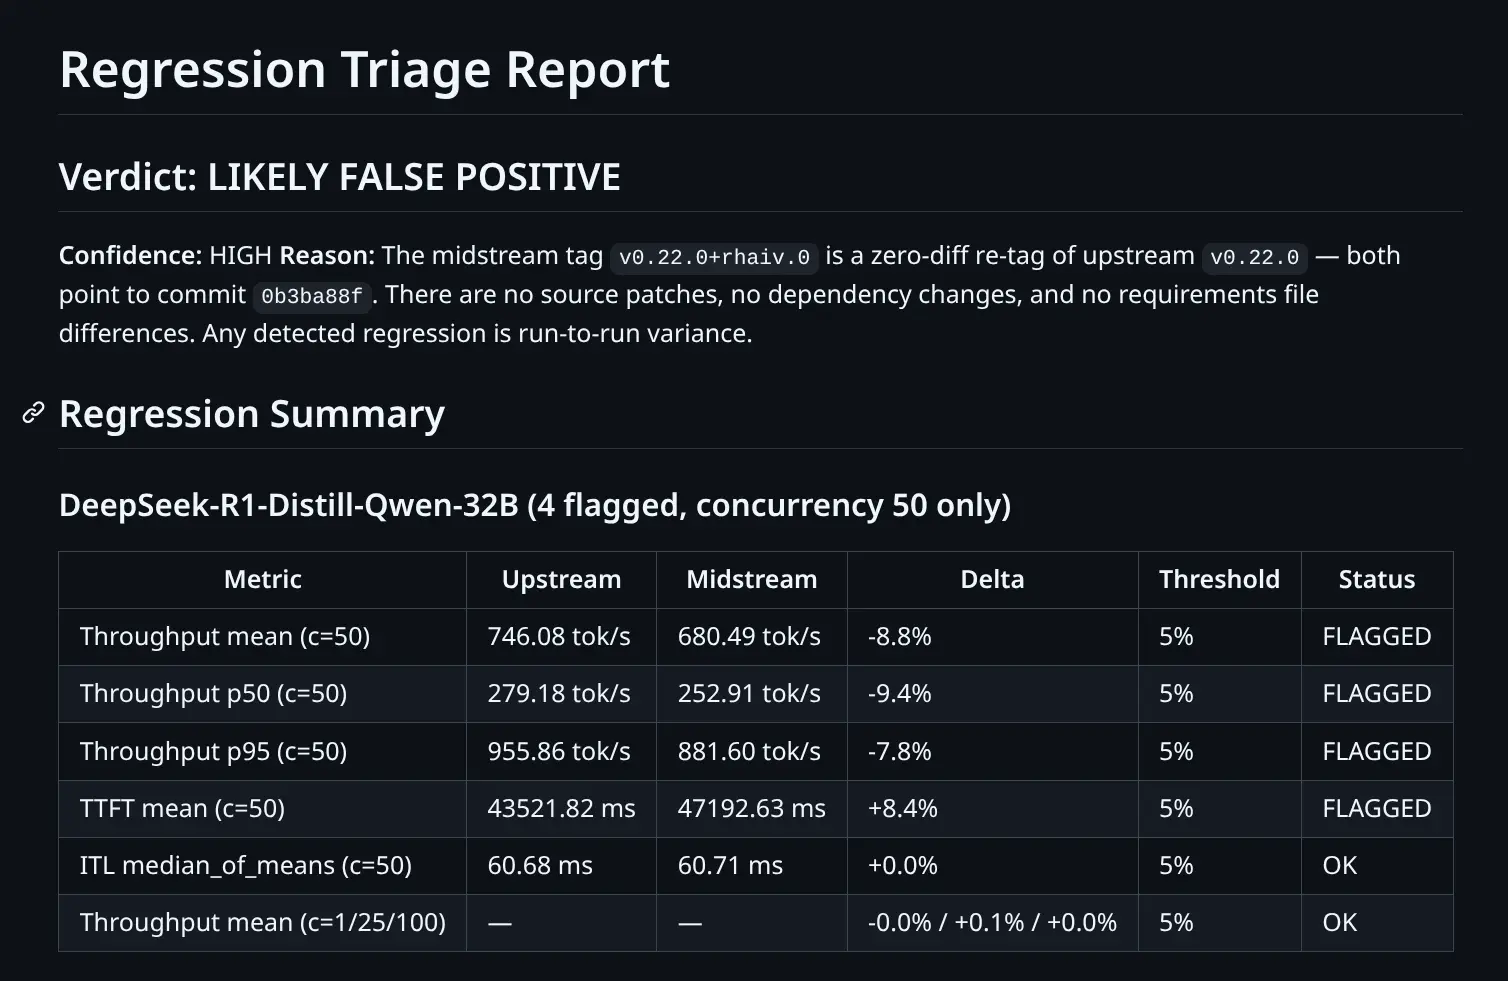
While trying to automate this triage, I found that having a set threshold like 5% could flag a lot of false positives, especially for point statistics like the median or mean. With limited requests (because testing needs to be quick for releases), I implemented a new test (figure 5) to compare the holistic shift of a request distribution (Wasserstein distance).
Instead of observing whether the median got worse, I check whether the entire distribution of response shifts. That's what the Wasserstein distance measures. It quantifies how much "work" it would take to reshape one distribution into another.
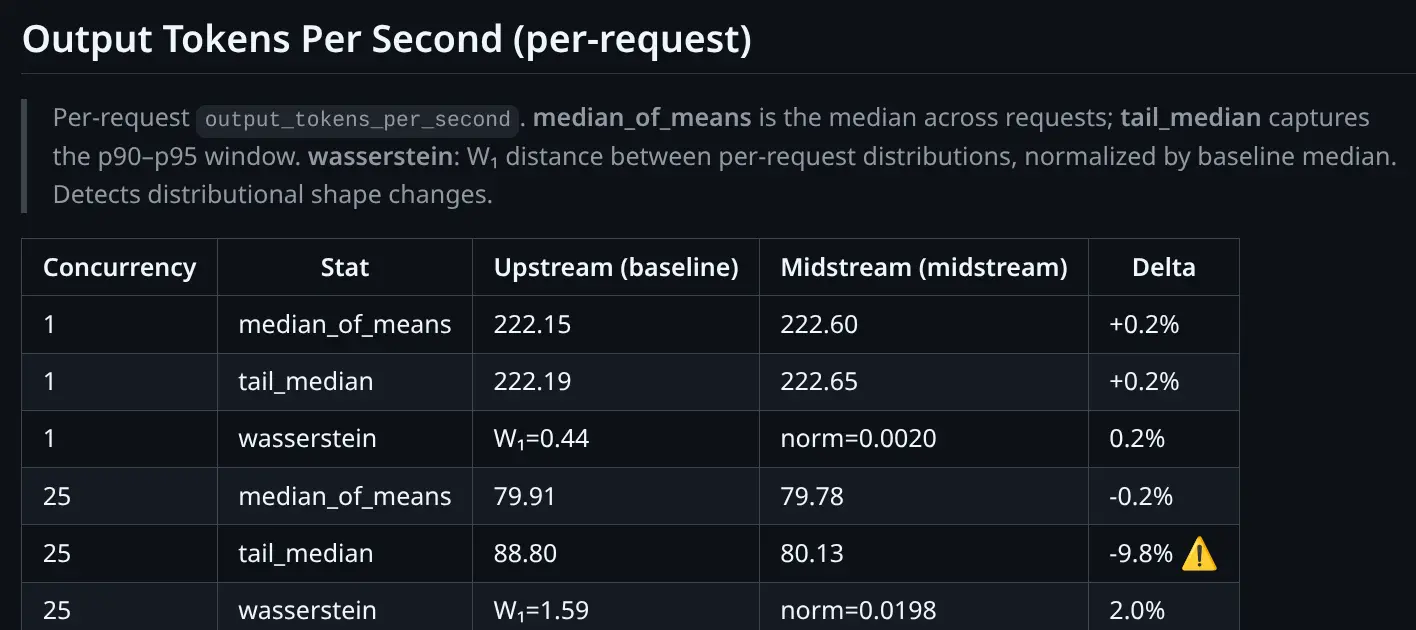
A small Wasserstein distance means the overall performance profile is essentially the same, even if individual percentiles fluctuate. A large distance means something fundamentally changed in how the server is handling requests
Note that this is not replacing point statistics, but rather acting as a secondary check to verify that a real regression actually exists.
Conclusion
More code changes means more reviews, forcing CI/CD to be quick, while also maintaining precision in testing. With the rise of coding agents, novel AI research, and growing consumer demands for models, we're making progress exponentially faster in development than we were just a year ago. I'm excited to see how the development process continues to evolve as we see more open source models released.
If you have questions or want to discuss anything in further detail, connect with me at linkedin.com/in/christophermiyai.

