AI can help operations teams make sense of an incident, but understanding a problem is only half the challenge. The next question is: How do you turn that insight into a safe, repeatable action? To explore this, I built a simple AIOps workflow using an AWS EC2 instance running Red Hat Enterprise Linux (RHEL), Red Hat Ansible Automation Platform, Claude Code, and model context protocol (MCP).
The goal was straightforward: Intentionally break a sample application, investigate the problem, let AI analyze the evidence, and use Red Hat Ansible Automation Platform to perform and verify the remediation.
Demo repository: The application code, Ansible playbooks, and configuration used in this demo are available in the GitHub repository.
The workflow
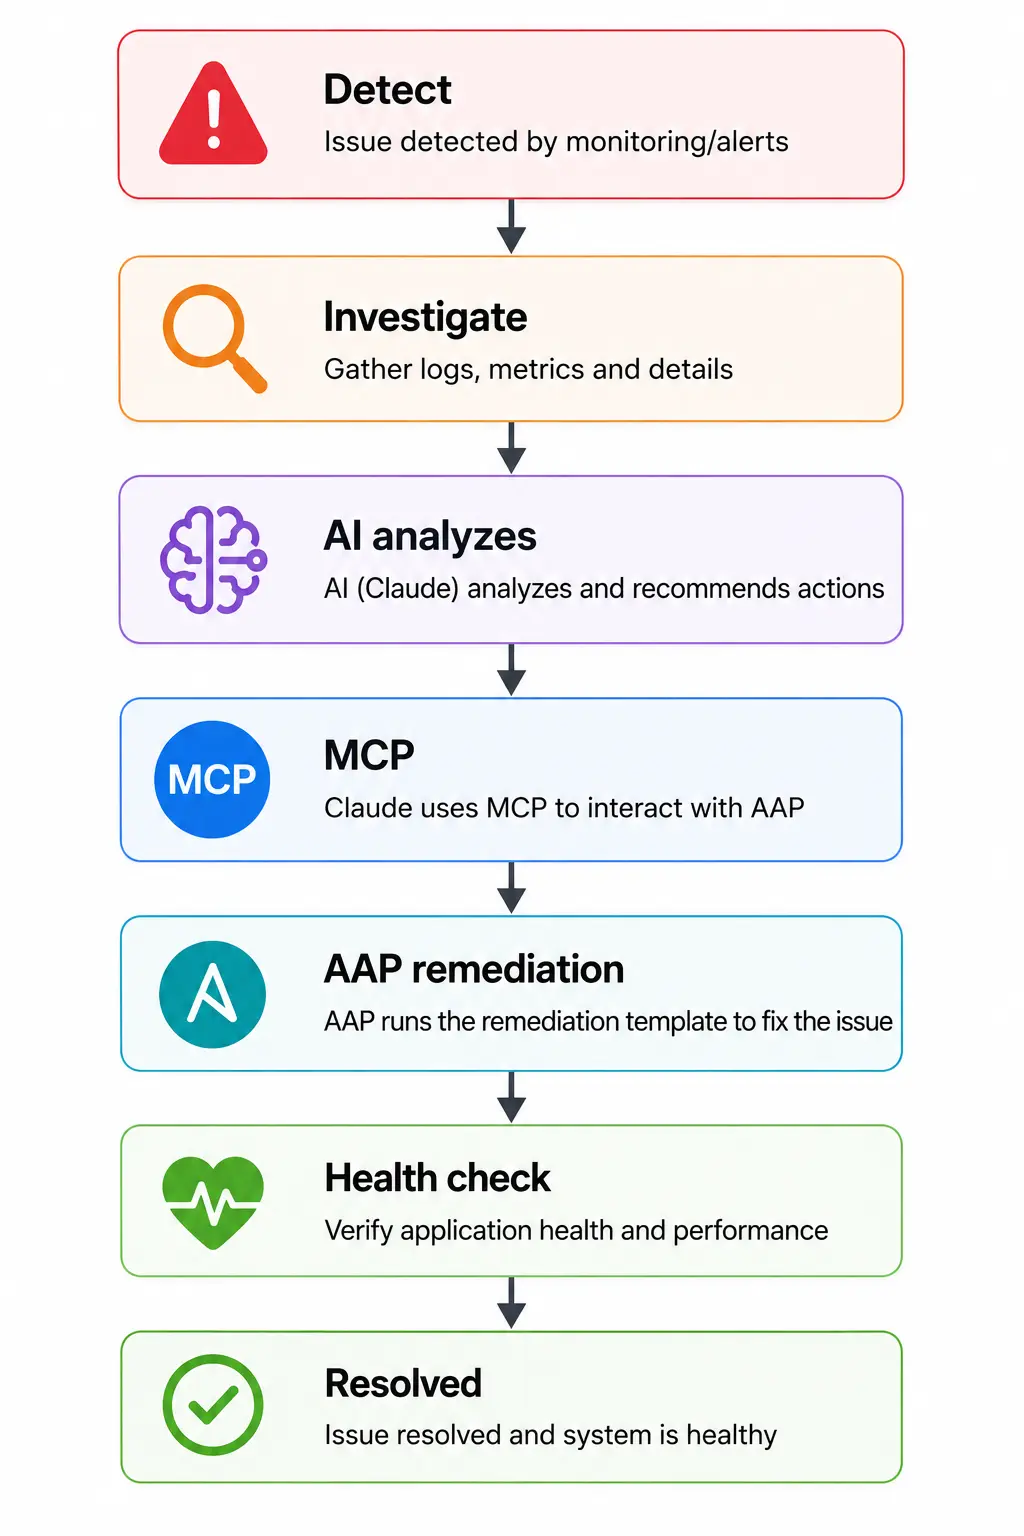
The important part is that AI never directly logs into the RHEL server. Ansible remains the execution layer. Figure 1 illustrates the workflow:
Start with a real application problem
The demo uses a product catalog application running on an instance of Red Hat Enterprise Linux on AWS. Before introducing failure, I tested the application with curl and confirmed that it was healthy:
curl -i http://localhost:8080/healthThe application returned (see figure 2):
HTTP 200 OK
{"status": "healthy"}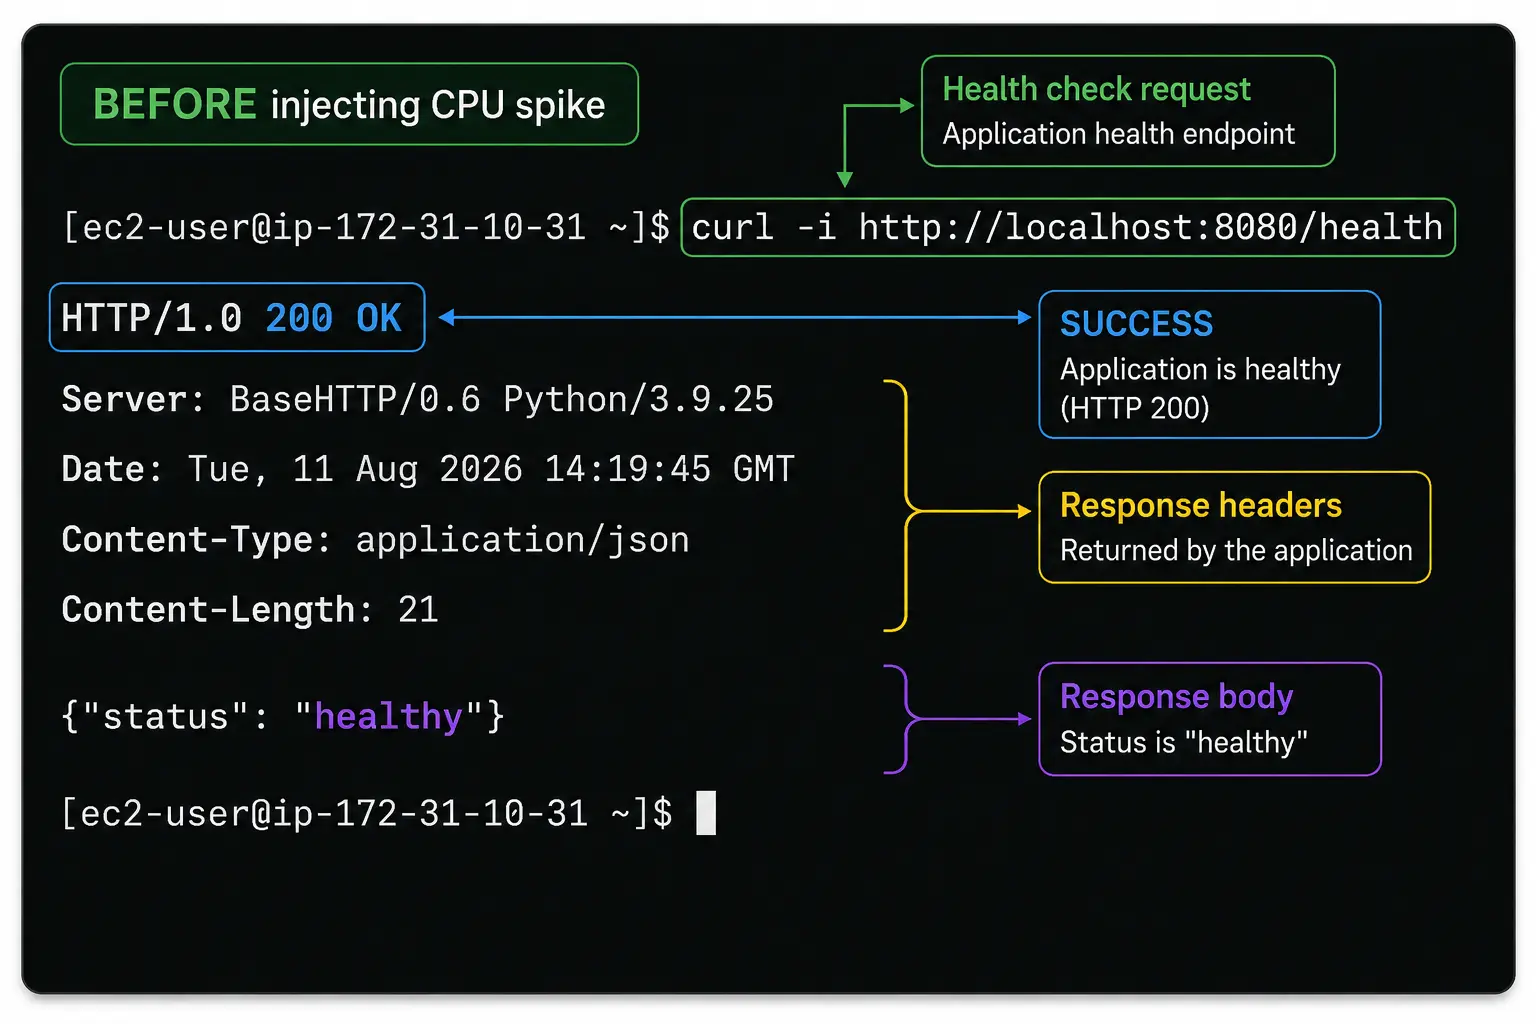
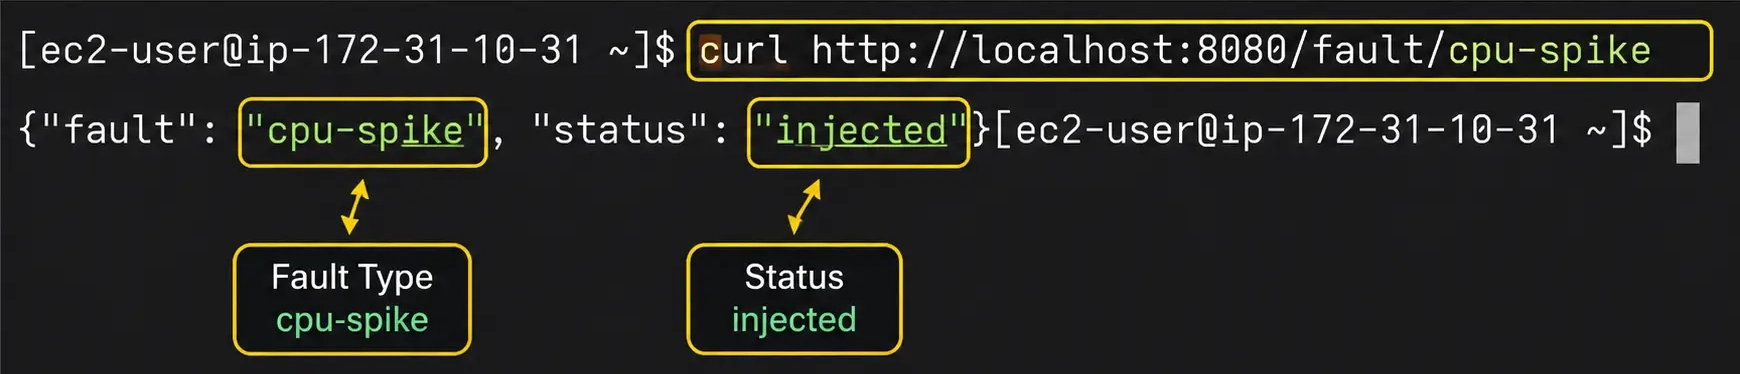
I then injected a CPU spike into the application:
curl http://localhost:8080/fault/cpu-spikeThe fault injection returned (figure 3):
{
  "fault": "cpu-spike",
  "status": "injected"
}
Verify the impact:
curl -i http://localhost:8080/healthHTTP/1.0 503 Service Unavailable
{"status": "degraded", "message": "Application experiencing high CPU load"}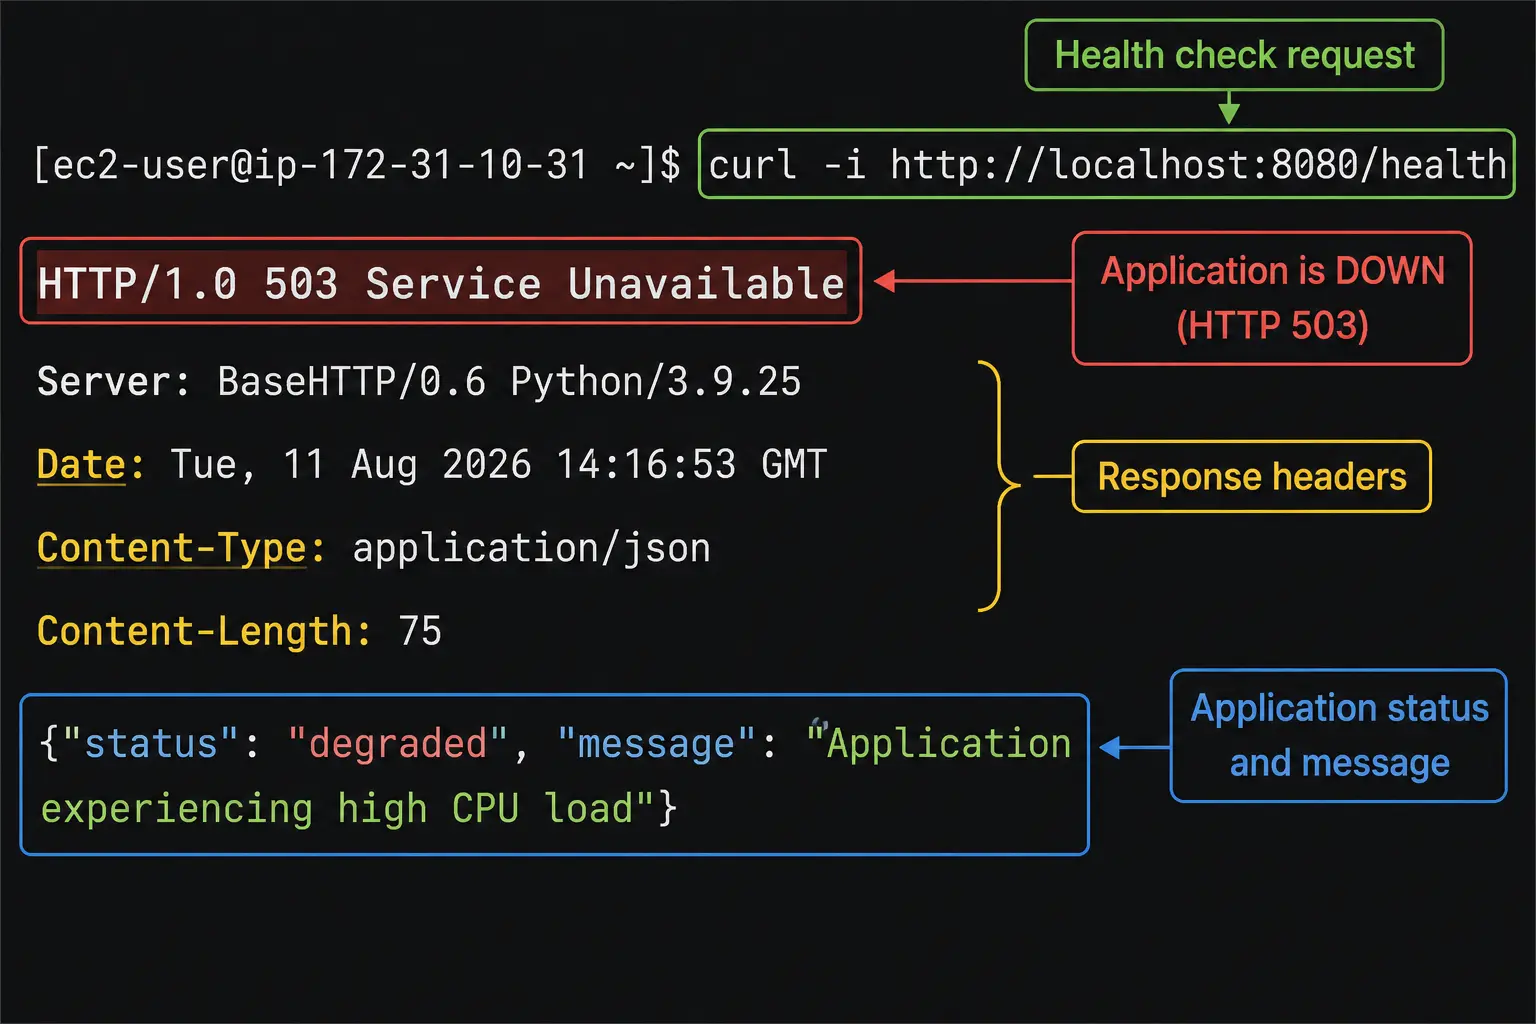
This gave us an actual operational problem to investigate (see figure 4) rather than a hypothetical alert.
Use Ansible Automation Platform to investigate
The first step is to collect evidence. The first Ansible playbook collected the information we would normally look at during troubleshooting:
- CPU utilization
- Top CPU-consuming processes
- Application process
- Application health
- HTTP status
For example:
- name: Check CPU utilization
  ansible.builtin.shell: |
    top -bn1 | grep "Cpu(s)" | awk '{print 100 - $8}'
  register: cpu_usage
  changed_when: false

- name: Find top CPU-consuming processes
  ansible.builtin.shell: |
    ps -eo pid,ppid,%cpu,%mem,comm,args --sort=-%cpu | head -10
  register: top_processes
  changed_when: false

- name: Check application health
  ansible.builtin.uri:
    url: "http://localhost:8080/health"
    method: GET
    status_code:
      - 200
      - 503
    return_content: true
  register: app_health
  failed_when: false
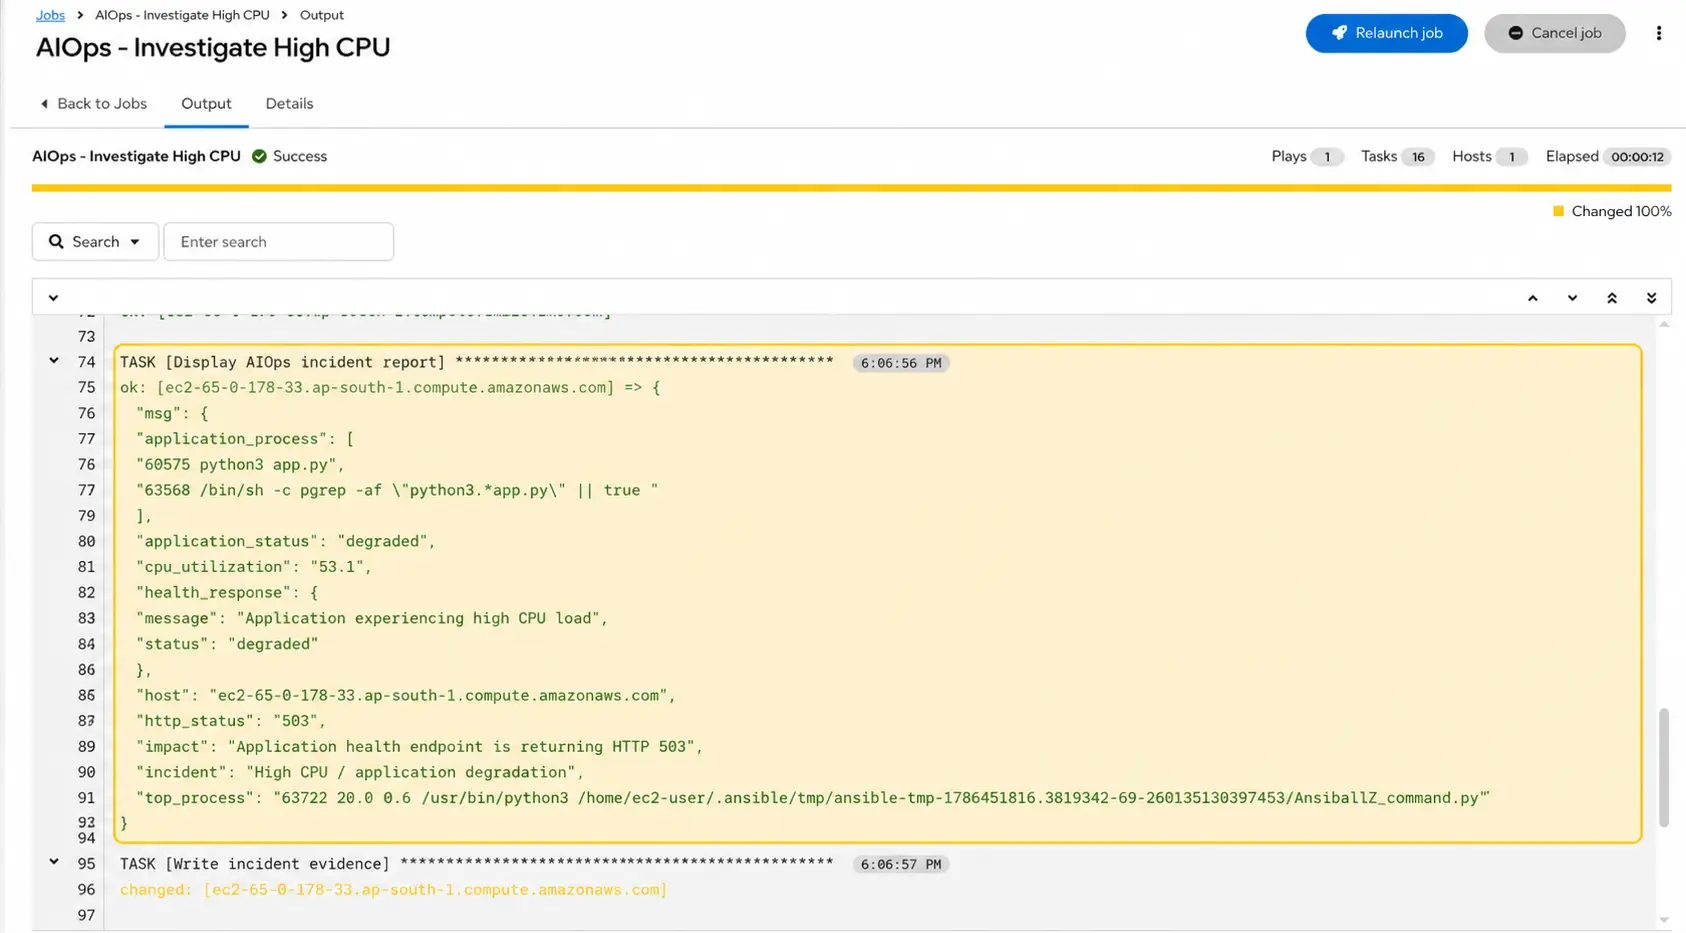
The investigation produced structured information such as:
{
  "cpu_utilization": "53.1",
  "application_status": "degraded",
  "http_status": "503",
  "incident": "High CPU / application degradation"
}
It also identified the processes consuming CPU on the host. This is important because the AI wasn't asked to simply guess what was wrong. Ansible first collected the operational evidence, as in figure 5, and gave the AI something concrete to reason about.
The complete investigation playbook is available in the repository under investigate_cpu.yml.
AI analyzes the incident
I passed the investigation results to Claude Code. The prompt was intentionally simple:
Analyze this operational incident.

CPU utilization: 53.1%
Application status: degraded
HTTP status: 503
Top process: python3 app.py

Determine:
1. Probable root cause
2. Application impact
3. Recommended remediation
4. Which approved AAP workflow should be executed
Claude analyzed the CPU utilization, application state, HTTP response, and process information and identified the Python application process as the likely contributor to the degradation.
It then recommended an existing Ansible workflow: AIOps - Remediate High CPU (see figure 6).
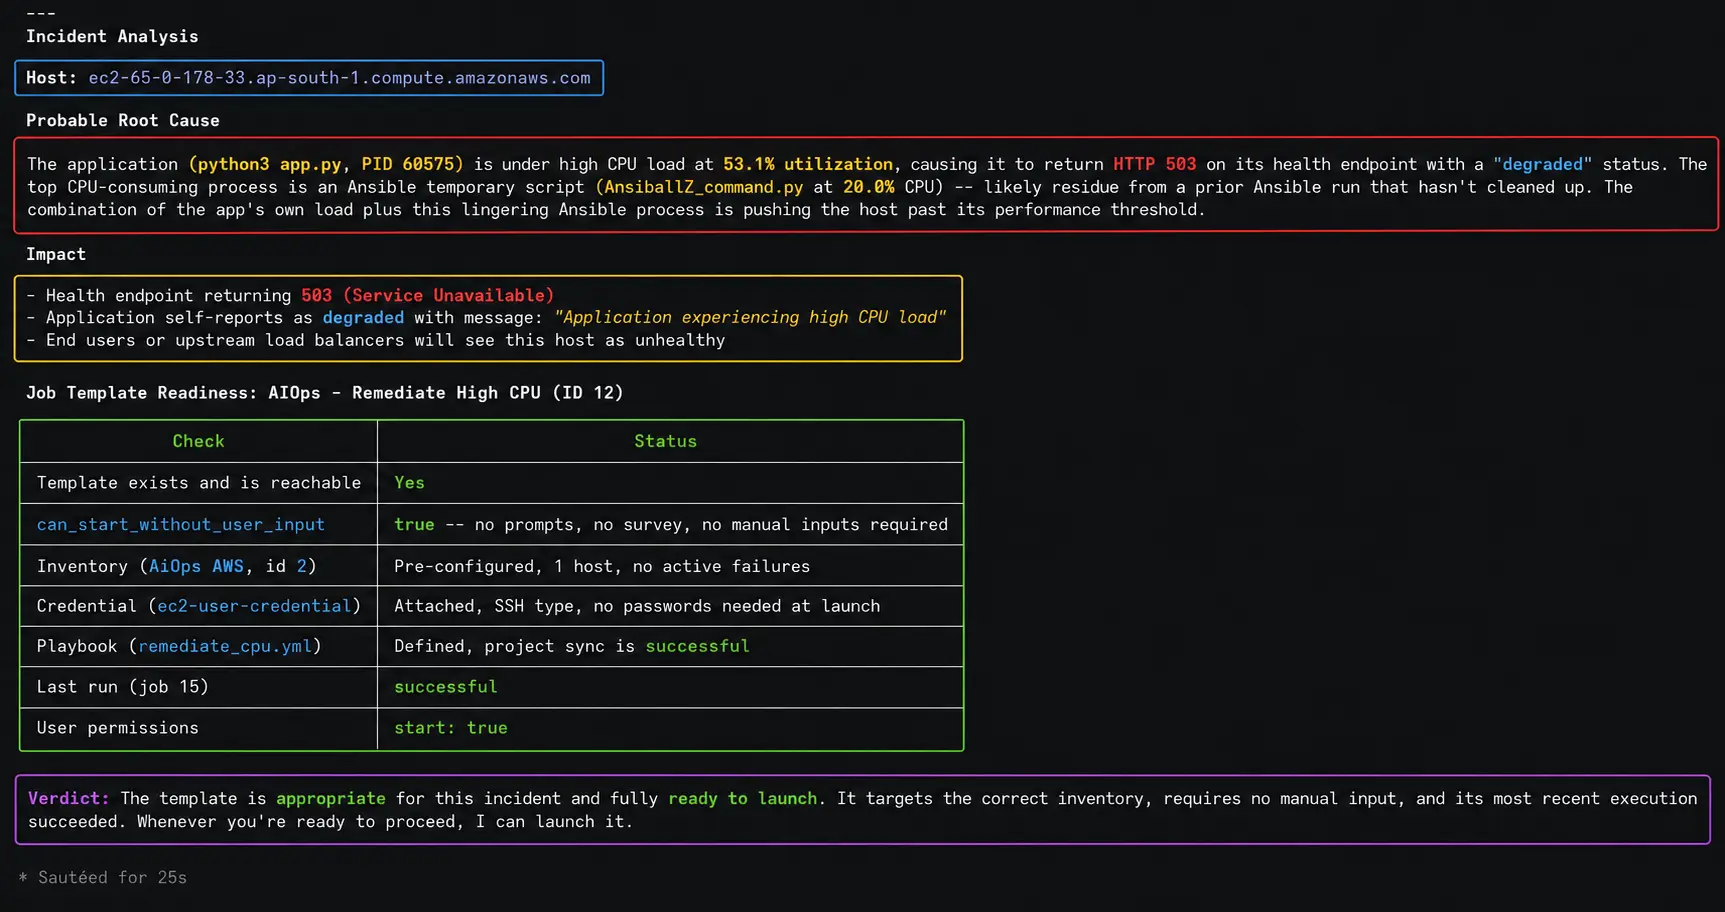
This is where AI added value. Rather than replacing the automation platform, the AI helped interpret the information and determine which existing automation was appropriate for the incident.
MCP connects AI to Ansible Automation Platform
Claude Code used the MCP server for Red Hat Ansible Automation Platform to discover the remediation Job Template and verify that it could be launched. The architecture was deliberately simple, and is illustrated in figure 7:
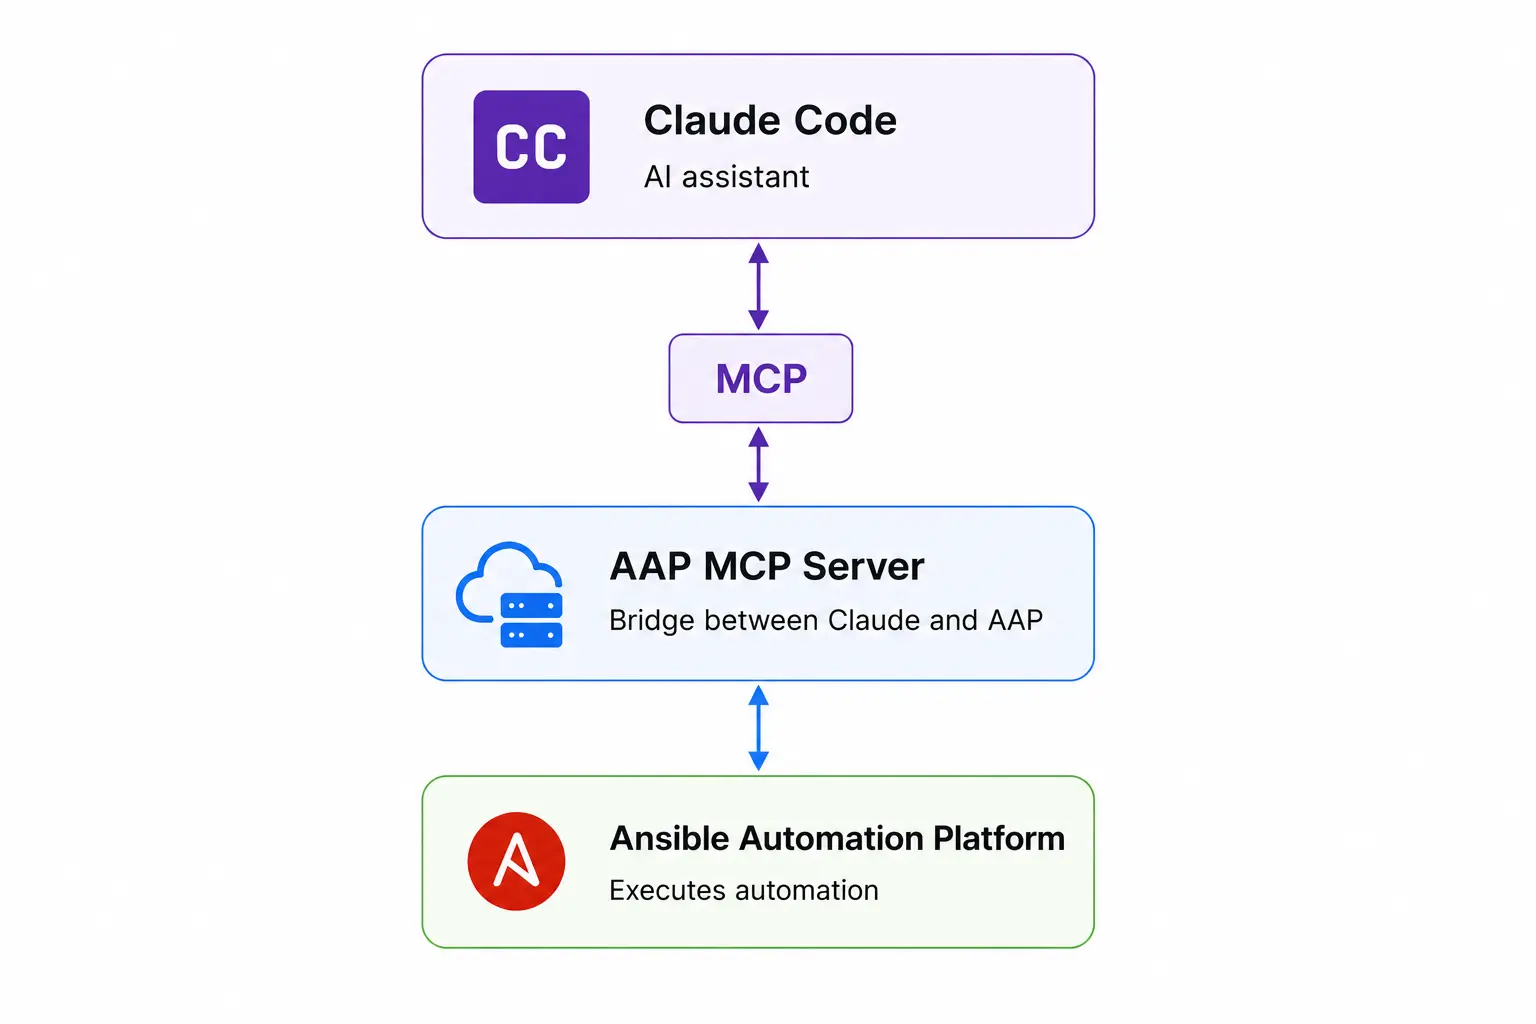
Claude was able to identify:
AIOps - Remediate High CPU
Job Template ID: 12
Permission: start = true
The AI did not have and did not need direct SSH access to the RHEL host. Instead, Ansible Automation Platform remained responsible for credentials, inventory, job execution, and the actual Ansible automation.
Ansible performs the remediation
The AI asked MCP to launch the approved Ansible workflow.
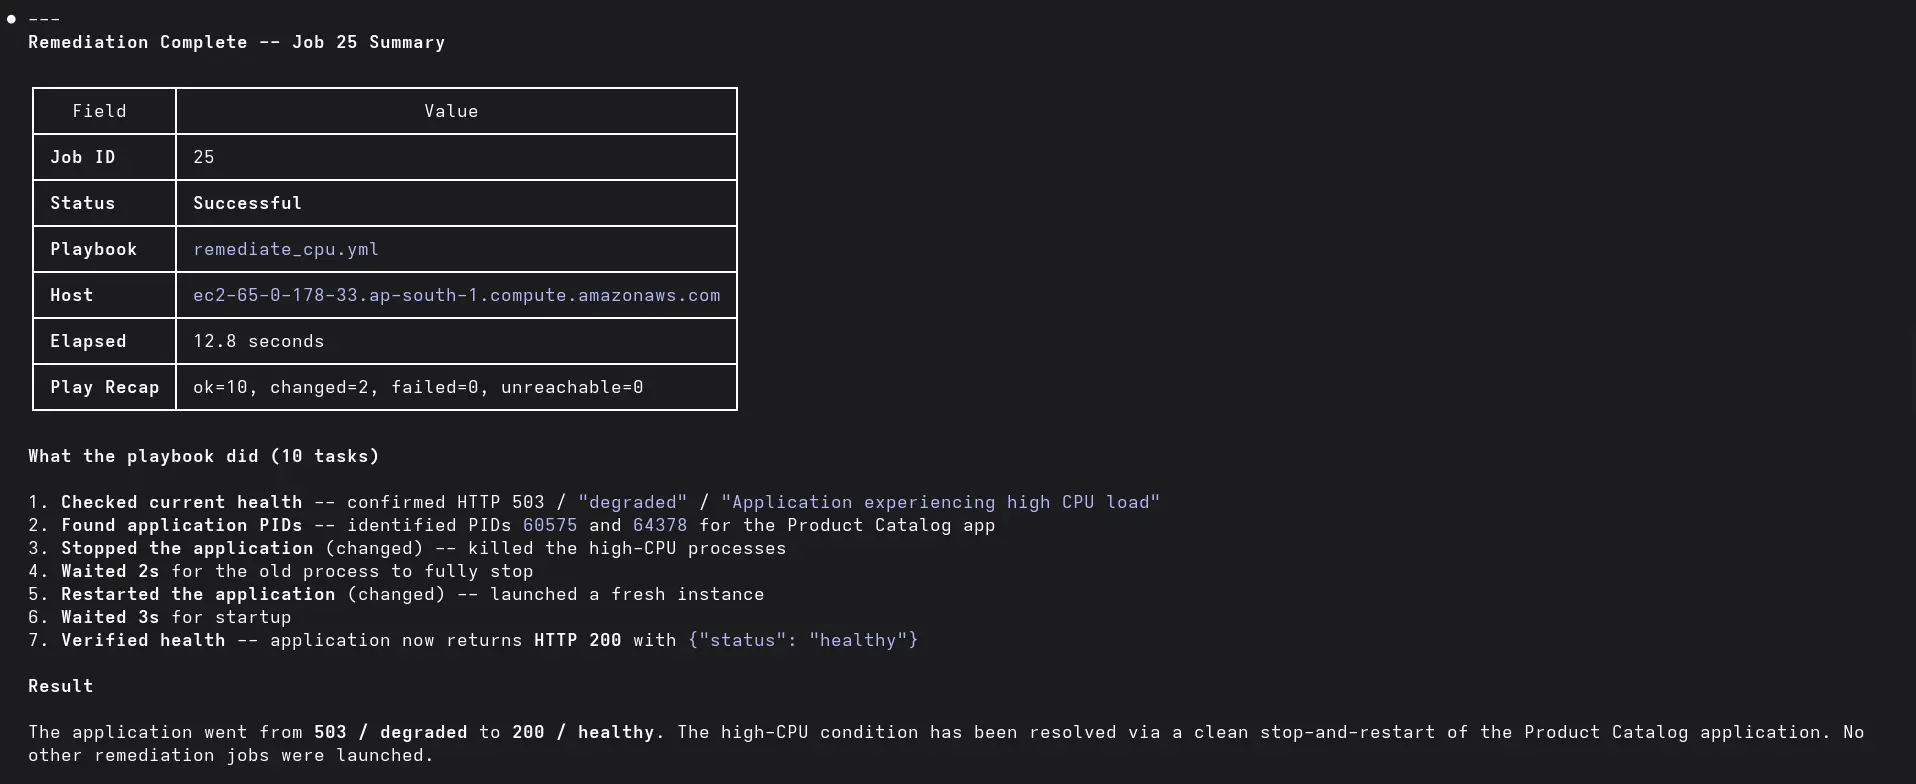
Ansible Automation Platform executed the Ansible playbook against the RHEL host. The result (also see figure 9):
Before:  HTTP 503 / degraded
After:   HTTP 200 / healthy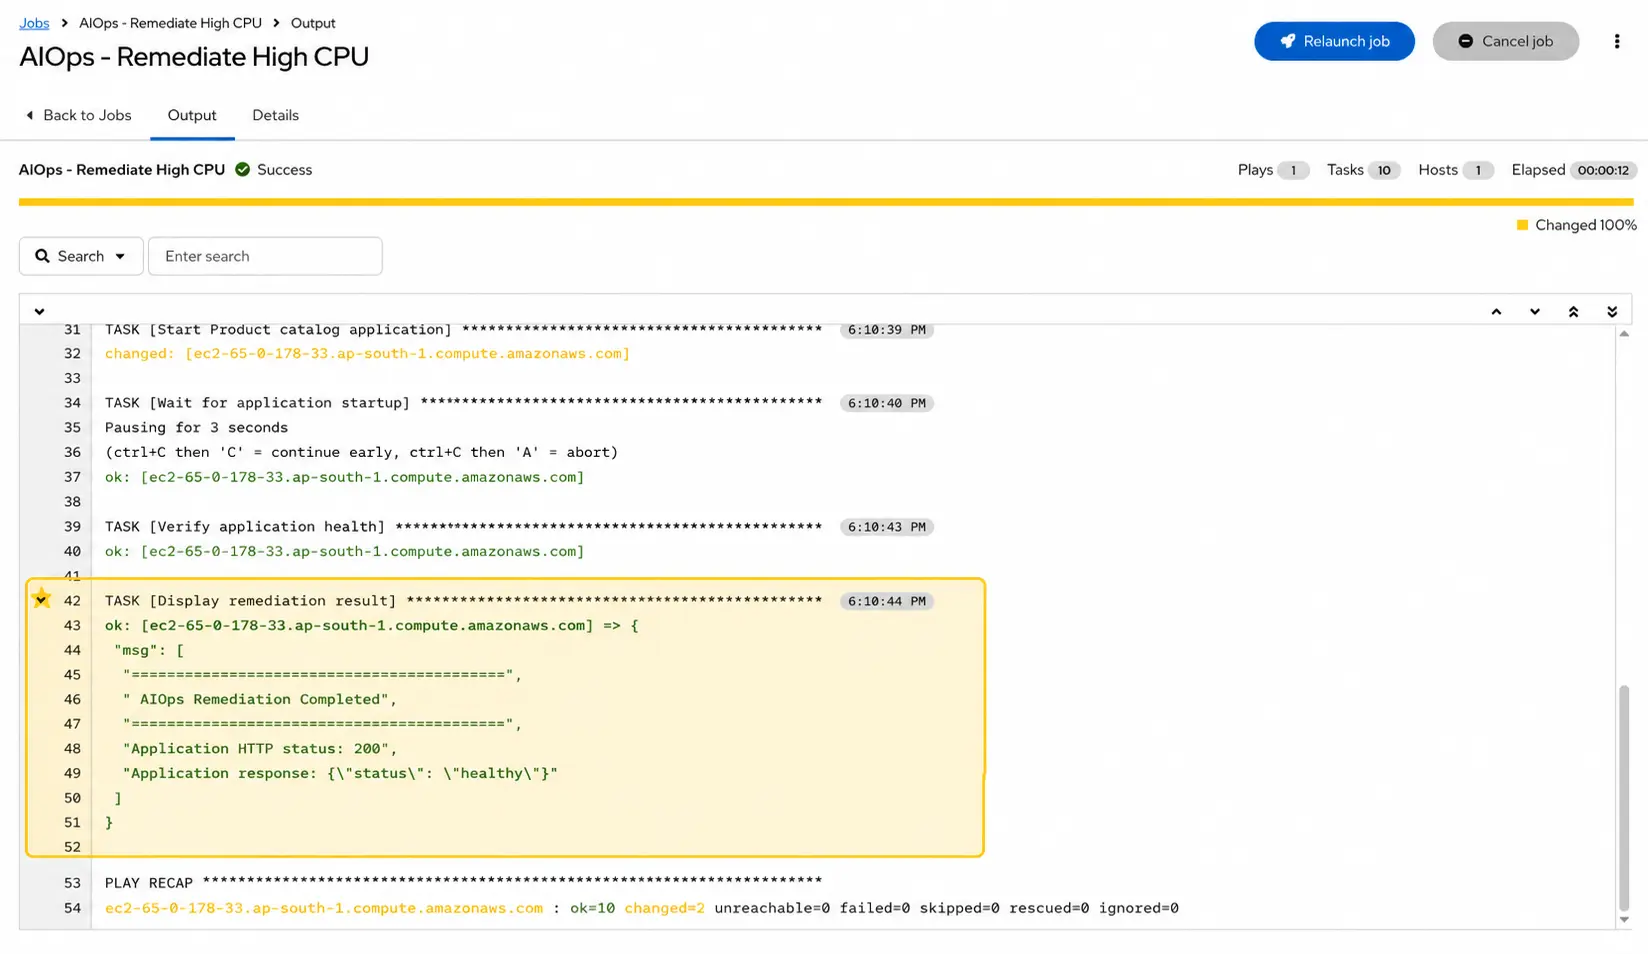
This is the part I like most about the design: AI made the recommendation, but Ansible did the actual work.
Verify the recovery
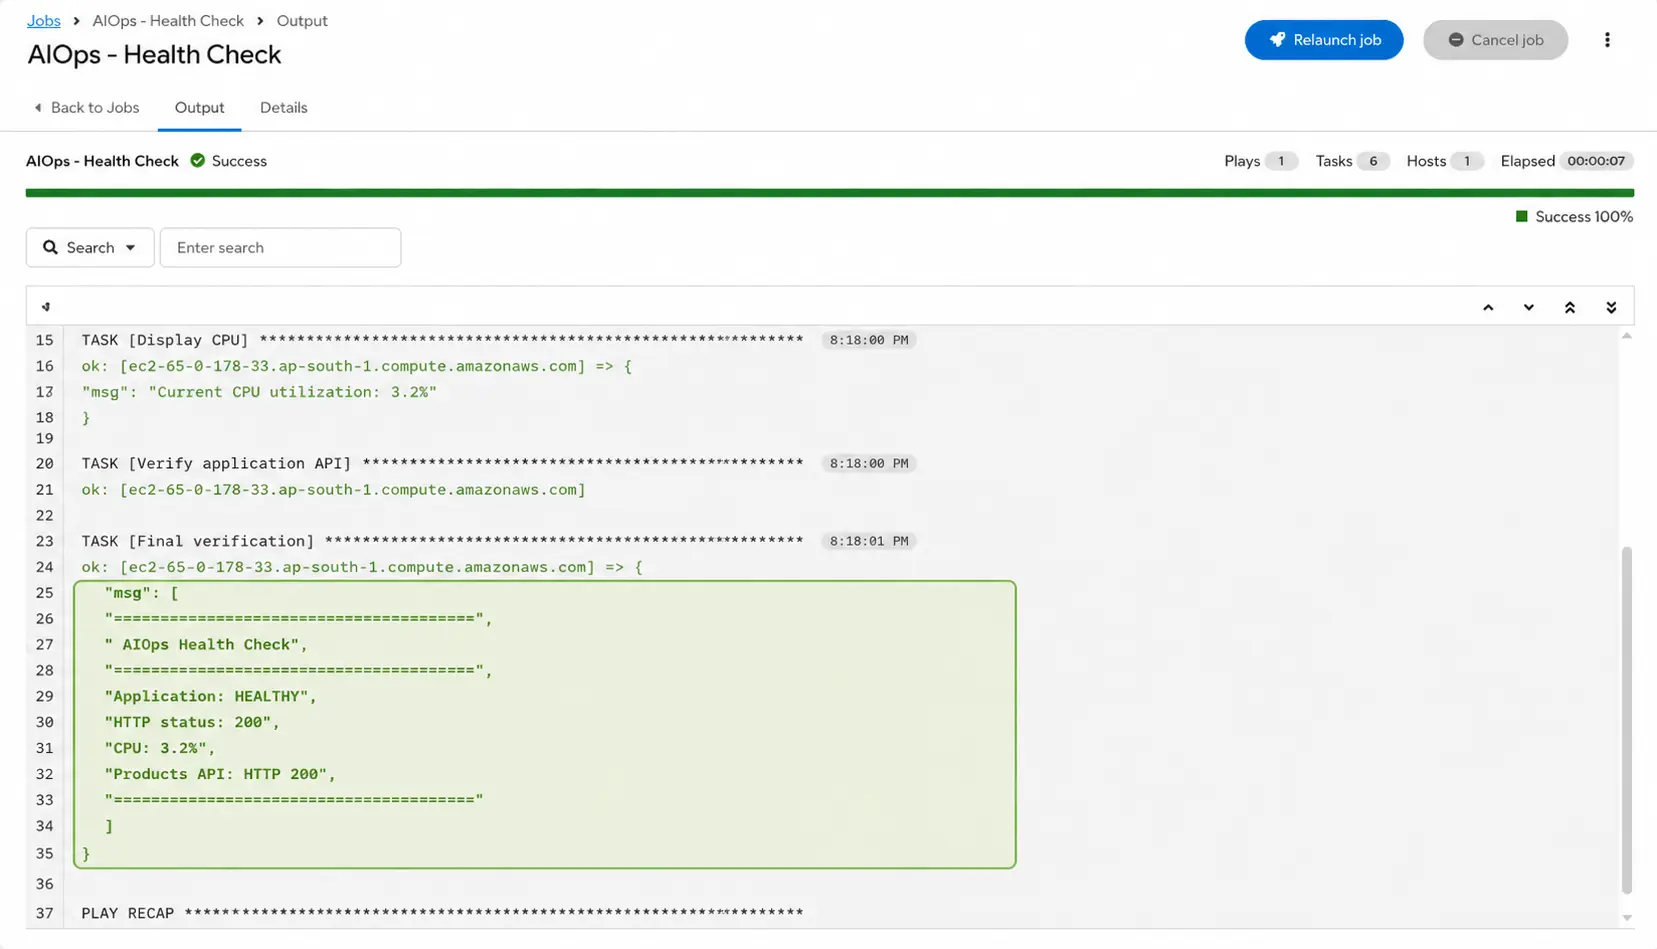
Remediation isn't complete until recovery is verified. The final step is for the AI to use MCP to run the existing AIOps - Health Check workflow:
Remediate
    ↓
Health Check
    ↓
HTTP 200
    ↓
Incident resolved
In this scenario, the application was confirmed healthy, as shown in figure 10:
Conclusion
The complete workflow is:
Detect → Investigate → Analyze → Recommend → Execute → Verify
The key takeaway for me is that AIOps doesn't have to mean giving AI direct access to production systems.
AI can analyze the problem and choose the appropriate action, while Ansible Automation Platform provides the controlled, repeatable, and auditable execution layer.
Event-driven Ansible can be added later to automatically trigger the investigation when an alert arrives. For now, this gives you a simple and practical foundation for AI + MCP + Ansible Automation Platform.
Learn more
Explore how the MCP server for Red Hat Ansible Automation Platform can connect AI assistants with Ansible Automation Platform and enable AI-assisted automation workflows:

