Welcome back to our ongoing series about the Node.js reference architecture. Part 1 introduced what the Node.js reference architecture is all about. In this article, we'll dig into logging in Node.js. Understanding what tools to use for logging in your Node.js applications and deployments is a critical step to ensuring they run well in production.
Follow the series:
- Part 1: Overview of the Node.js reference architecture
- Part 2: Logging
- Part 3: Code consistency
- Part 4: GraphQL
- Part 5: Building good containers
- Part 6: Choosing web frameworks
- Part 7: Code coverage
- Part 8: Typescript
- Part 9: Securing Node.js applications
- Part 10: Accessibility
- Part 11: Typical development workflows
- Part 12: npm development
- Part 13: Problem determination
- Part 14: Testing
- Part 15: Transaction handling
- Part 16: Load balancing, threading, and scaling
- Part 17: CI/CD best practices in Node.js
- Part 18: Wrapping up
First, we will discuss why the Node.js reference architecture recommends Pino as a great tool for logging in to your Node.js application. Then we'll walk through an example based on an IBM team's experience with integrating logging into a Node.js application.
Note: As with all our Node.js reference architecture recommendations, we focus on defining a set of good and reliable default choices. Your team might deviate from some of these recommendations based on what best fits your use case.
What makes a good logging tool?
Before deciding which tool to recommend, we had to define the requirements for a good logging tool. We quickly agreed that the logger we chose should be:
- Able to support structured logging/JSON format.
- Simple—given the availability of modern log repositories and viewers, we wanted to select a simple logger and recommend doing any complex filtering/handling outside of the Node.js process itself.
- Actively maintained—this might seem obvious, but in this process, we realized that one team was using a logger that was no longer maintained. That's certainly a reminder to keep an eye on your dependencies!
Best practices for Node.js logging
Our team also agreed on the following guidelines for what is good practice when logging errors in Node.js:
- Send logs to standard out (stdout). Use log aggregation tools to collect logs across processes, containers, and applications. All log processing should be done in a separate process.
- Plan for a final resting place for log data. After seven days, migrate log data to a lower-cost storage. Manual retrieval is likely okay.
- Add code to your application that allows
logger.levelto be set through an environment variable so that can be easily changed in container environments. - Use the redaction option to ensure sensitive data is not logged.
- Limit the use of warn, error, and fatal levels to information that must always be logged.
- Limit the use of info level to important information, which can always be logged without introducing significant overhead. Customer-usage REST response logs (status/duration/URL) are recommended at this level for security auditing purposes.
- Don't throw and catch multiple errors—throw once and catch/log at the highest level.
Why Pino is the best logger
Based on the requirements and guidelines that we agreed on and the loggers the team members experienced, there were several good options. We decided on Pino for the following reasons:
- Large-scale deployment success: Some of our production Node.js deployments already used Pino, so we have seen it succeed in real-world, large-scale deployments.
- Sample and starter kit support: We already used Pino in a number of our samples and starters, so we were confident in its use for other teams.
- Ease of use: Of the choices which supported structured/JSON logging, Pino was the easiest for developers to start with. Although other options had fuller features, our belief that the logging option should be simple led us to choose Pino over other tools.
Real-world implementation of logging guidance
How do all these recommendations translate to real-world implementation? While the reference architecture sticks to concise recommendations, we want to expand a bit on the "why" behind our decision and offer real-world examples of Node.js usage key concepts. This section discusses one team's implementation of these logging principles in detail.
At this point, Jim will share details about his team's experience with integrating logging into a Node.js application at IBM. Hopefully, you'll see how this perspective (along with others) has shaped our guidance and preceding recommendation.
Structured logging
A good logging strategy ensures that your logs are structured as carriage-return separated JSON blocks; this makes it easy for modern log repositories and viewers like LogDNA, Kibana, and Loggly to sort and filter various keywords in the JSON block. Even though modern logging repositories will turn string-based logs into JSON logs internally, providing JSON logs allows your applications to define their own custom keywords to sort or search. It's still common for shell scripts at the startup of a container to not use JSON logs but to have a Node.js process in the same container use JSON logging after startup.
Development teams sometimes push back against this because logs become harder to read when viewed in a log file. A workaround we use is to use a log formatting method to sort specific fields to come in the same order as the non-JSON format. For example, first in the serialized JSON block is the timestamp, level, then message, with the rest of the keywords following them in any order.
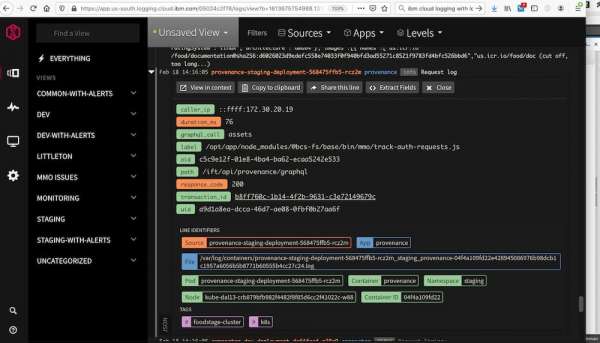
Modern logging repositories handle the storage, filtering, and visualization of the logs that your application generates. Figure 1 shows an example of viewing logs that the IBM Log Analysis service has fed into LogDNA. (The graphql_call and transaction_id fields you can see here will be discussed in the section on using logging formatters and thread-local variables.)

Static and dynamic log-level management
Early on, you should define a standard set of log levels that application developers should use. These might differ based on your chosen logging tool, but having them well defined helps ensure consistent use across your team.
Your team should review all the spots an application will generate an error log to confirm that the different variables needed to debug that error path are logged. Doing so helps you avoid needing to re-create the problem later with more detailed logging. Your goal should be "First Failure Data Capture" so that you don't have to recreate problems to debug customer issues. If you need additional data to debug a customer issue, you should create a separate issue to track adding additional logging to cover the additional data that was needed in that error path.
As noted, the initial application logging level is determined by the environment variable setting. However, we found certain "corrupted state" cases where we wanted to change the logging level to be more verbose without redeploying or restarting the application. This occurred when we started to have occasional database or queuing-service errors. We used a hidden REST endpoint that was not exposed publicly, but we could still invoke it using admin-routing tools like kubectl proxy. The REST endpoint could communicate with the logging library to change the logging level dynamically.
Logging formatters and thread-local variables
Logging formatters are customizable methods that allow applications to add or transform data into the outputted JSON logs. Using formatters to export specific thread-local variables into the logs is a powerful technique for getting useful data that your support teams will want in all your logs.
For example, your support team might want the ability to filter logs to a specific failing REST call. Generating and storing a REST call's trace-guid as a specific thread-local variable early in the REST processing (i.e., one of the first express middleware layers) allows anyone following logs in that REST call to then share that same trace-guid.
Customer error messages that provide that trace-guid make it simple for your support team to help the customer by filtering that trace-guid to know exactly what the customer was doing. Otherwise, your support team has to hunt through logs for errors with similar timestamps, which is time-consuming. There are other ways to get cross-transaction information, including distributed tracing, but it's often still useful to include this kind of information in logs.
While Node.js doesn't have obvious thread-local variable support like Python and Ruby, it does have that functionality exposed through its async-hooks library. Specifically, in the latest Node.js versions, you can access AsyncLocalStorage. These APIs are still experimental but have been relatively stable over time. Otherwise, if you are still using older Node.js versions, you can use the cls-hooked library even back to Node.js 8 to get equivalent functionality.
Good thread-local variables to set in a common authentication-validation layer include user-guid (as opposed to an email address for GDPR compliance), organization-id, and if the user is an application admin. Those allow security auditors to trace what actions a specific user or organization has done and validate your own admins have not taken inappropriate actions.
If your application uses GraphQL, you will notice that because all the GraphQL calls share the same entry endpoint, traditional REST trace logs are not very helpful, as they won't indicate which GraphQL call was invoked. We updated our GraphQL entry methods to set the method name in a thread-local variable so that we could include the name in the REST trace logs.
Logging the real IP
In most Kubernetes-based deployments, the source IP address that the applications see is just that of the ingress router and not from the caller. If you use a security firewall in front of your Kubernetes cluster (like this Cloudflare service offered in the IBM Cloud), the caller's IP address will be stored in an X-Forwarded-For header. The application endpoint handler can then extract and log the header instead of the REST request's IP address. If you are not using a front-end like that, you might have to specifically configure your load balancer and ingress to ensure the public IP is carried into the Kubernetes ingress and then into your application.
Configuration logging at startup
Dumping the application configuration settings at startup can help developers quickly identify and understand configuration problems instead of guessing what the configuration "should be." This provides key information that will save you time investigating issues while limiting the potential for sensitive information in subsequent logs.
However, doing that can sometimes expose values like passwords or apikeys that should normally remain secret. A common example is when a developer adds a printenv at the application's startup to dump all the environment variables and inadvertently exposes the DB passwords also passed in as environment variables.
Node.js libraries like convict make it easy to define how configuration settings are imported. They allow the app to determine if the settings should be imported from mounted config-files, environment-variables, or both. They also determine what elements in a configuration are optional, what default settings should be, and if a field's value should be treated as sensitive (i.e., value is a password or apikey). As long as developers mark the password and apikey fields as sensitive in the definition of the configuration, then the configuration object can be safely logged at startup; the sensitive field values will be converted into asterisks.
Because we mentioned sensitive information, it's also important to consider the information your application is gathering and use redaction to remove sensitive fields when logging that information.
What’s next?
We hope this article has given you more insight and background on the recommendations and guidance in the logging section of the Node.js reference architecture, along with a deeper dive into some of the team's experience and what we've found useful.
Part 3 of this series covers code consistency in Node.js. Check out the GitHub project to explore sections that might be covered in future articles.
To learn more about what Red Hat is up to on the Node.js front, check out our Node.js topic page.
Last updated: January 9, 2024

