

Red Hat Enterprise Linux (RHEL) 8/9 provides virtualization functionality, which enables a machine running RHEL to host multiple virtual machines (VMs), also referred to as guests. The basis of creating VMs on RHEL is the hypervisor software stack that controls hardware and enables running multiple operating systems on a host machine. The hypervisor stack consists of the kernel based virtual machine module (KVM) and virtualization kernel drivers, the QEMU emulator that simulates a complete virtualized hardware platform and manages how resources are allocated on the host and presented to the guest and the libvirt software suite that serves as a management and communication layer, making QEMU easier to interact with, enforcing security rules.
This article will describe how to set up an ACPI debugging environment for Windows VMs running on QEMU on RHEL hosts. This can be used to troubleshoot Windows VMs in case one runs into ACPI related issues when starting and/or running VMs.
Requirements
- Around 80 GiB of disk space. This guide uses LVM logical volume for VMs. We will need around 40 GiB for Windows debug server and around 40 GiB for Windows debug target. For LVM volumes, please make sure that the volume group has at least that much free space.
- Red Hat Enterprise Linux 9 host with virtualization feature enabled. Instructions on how to enable virtualization features for RHEL 9 are provided in Enabling virtualization (RHEL 9).
- The RHEL host should have a minimum 6 GiB of RAM memory.
- Internet connectivity to download necessary Windows debugger packages.
- This guide will use Windows 10 Enterprise for RHEL VMs.
This guide will start with the first step of installing and configuring Windows VM (further WinDbg VM) to host the Windows debugger. This is the guest where we will run all the debugging commands from within the Windows debugger. Next, we will describe how to set up the target windows guest (the guest that is being debugged). The two guests can run the same version or different Windows versions. They can also be of different bit-size such as 32-bit or 64-bit. The server and the target will communicate over a virtual serial port. Lastly, we will describe how to run ACPI debug commands and get ACPI related debug information from the target Windows VM.
Installing Windows guest for using as a debug server
Steps:
- Look at all the volume groups in your RHEL host and check to see which one has enough space:
$ sudo vgs
VG   #PV #LV #SN Attr   VSize   VFree
slow   2  12   0 wz--n-   2.72t  1.59t
The above shows that the volume group “slow” has almost 1.6 TiB of free space and can easily accommodate 80 Gib disk space.
- Create the logical volume with 40 Gib of disk space:
$ sudo lvcreate -n win10-dbgserver -p rw -L 40G slow - You need to open up the VNC port so that you can access the VM and interact with the Windows installation process through the firewall. In order to open up the VNC ports, use the following commands:
$ sudo firewall-cmd --permanent --add-port=5900/tcp
$ sudo firewall-cmd --reload
This will open up port 5900 so that you can connect to these ports on the remote host using the VNC client running on your local desktop.
- Start the installation process by starting the guest OS:
# virt-install \
--name=win10-dbgserver \
--os-variant win10 \
–-network=default \
--cdrom=/location/of/the/install/iso/win10-server.iso \
—-disk=/dev/slow/win10-dbgserver \
—-memory 2048 --vcpus 2 \
—-graphics vnc,port=5900,listen=<ip of local machine> \
—-cpu host
- Open the VNC client and point to port 5900 of the remote host. Install Windows like you normally would. It is preferable to disable updates so that Windows updates do not interfere with the debug process. Disable all unnecessary widgets and items.
- Install Windows Driver Kit (WDK) from the Microsoft website. WDK install should work even on relatively older versions of Windows, like Windows 2016 server or Windows 10 21H1 as well. The WDK would install the Windows debugger. Make sure you have Internet connection from within the guest OS in order to download the WDK. A relatively new version of the WDK presents the GUI installation screen shown in Figure 1.
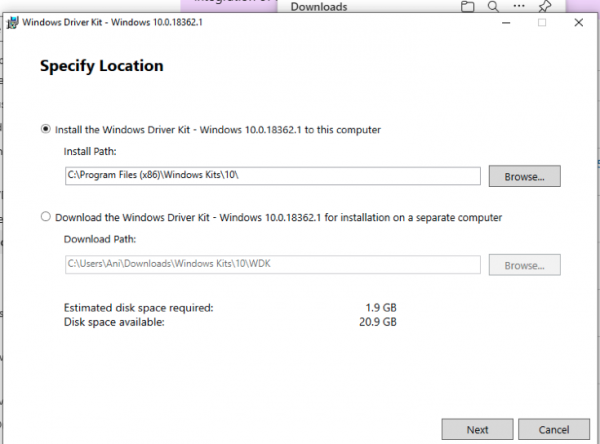
Figure 1: Specify a location to install the Windows Driver Kit. - Edit the virsh domain for the Windows debug server previously created using:
# virsh edit guest-name - Add a serial port which will be shared with the target. It will be a unix domain socket server accepting connection from the target client. The following XML code will do the job:
 <serial type='unix'>
      <source mode='bind' path='/tmp/servercon'/>
      <target type='isa-serial' port='0'>
        <model name='isa-serial'/>
      </target>
 </serial>
 <console type='unix'>
      <source mode='bind' path='/tmp/servercon'/>
      <target type='serial' port='0'/>
 </console>

Effectively this adds the QEMU command line -serial unix:/tmp/servercon,nowait,server
Here, /tmp/servercon is the shared serial port between the target and the debug server. nowait ensures that the server does not wait until the target writes to the serial port.
Starting up the Windows debug server
We will use the shared serial port between the debug server and the target for debugging. More details on how to configure the kernel mode debugging can be found in Connect to a kernel-mode WinDbg session and Setting Up Kernel-Mode Debugging of a Virtual Machine Manually using a Virtual COM Port.
Steps:
- Open a Command Prompt window as Administrator. We will use the x64 version of
WinDbg.exefrom the WDK that was installed as part of the Windows kit installation. We assume that the target is a 64-bit x86 Windows installation. If the target is a 32-bit version of Windows, please use the appropriate debugger version. See Choosing the 32-bit or 64-bit Debugging Tools for more information. cd C:\Program Files(x86)\Windows Kits\10\Debuggers\x64- Start WinDbg debugger from this location.
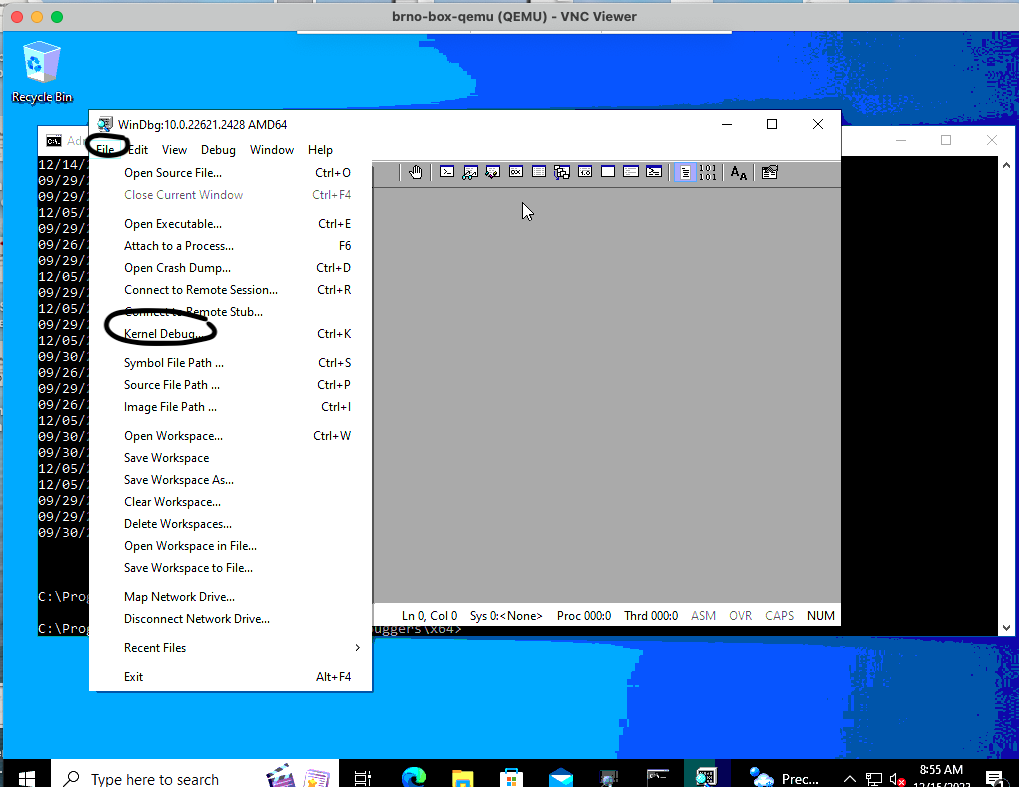
- Go to File → Kernel Debug (Figure 2) or press Ctrl-K.

Figure 2: The Kernel Debug option in WinDbg. - Select the COM tab and enter
com1for Port and115200for Baud Rate. Select Reconnect and then press OK. See Figure 3.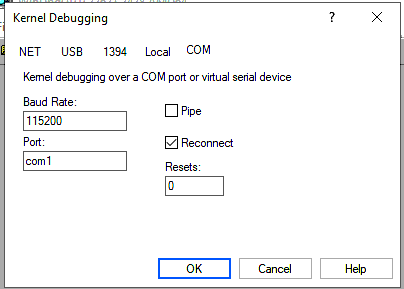
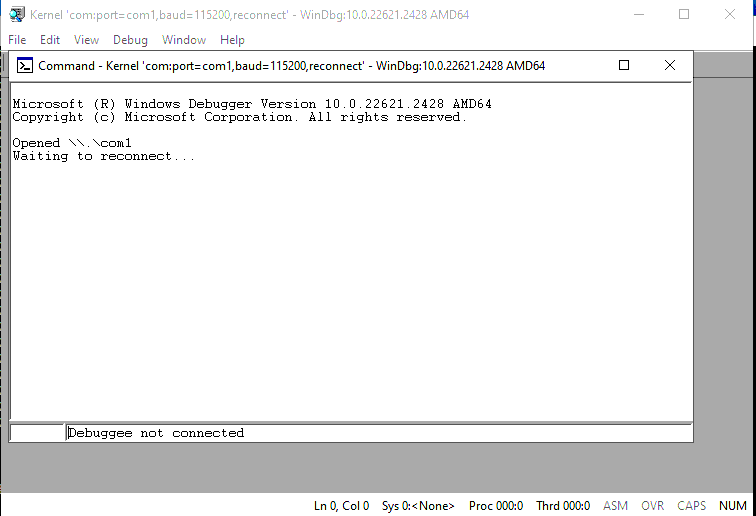
Figure 3: Configuring the Kernel Debugging option in WinDbg. - Your debug server is ready and waiting for the target to connect (Figure 4).
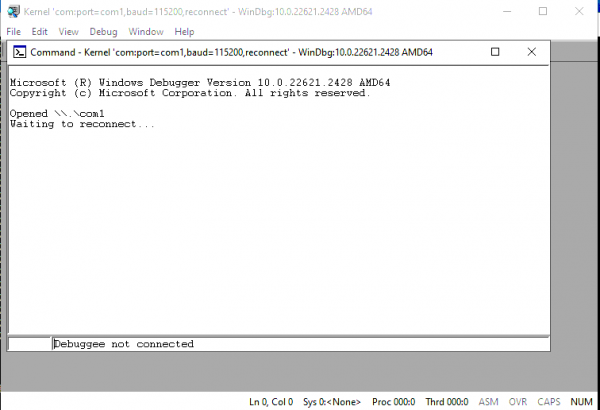
Figure 4: The WinDbg server waiting to connect. - There are times when the debugger might crash and you may need to restart it. This is normal.

Starting and setting up Windows debug target
The steps to install Windows debug target VM are the same as that of the debug server steps above including creating a separate logical volume for the target VM. Please use different VNC ports for server and target as you would want to run both at the same time.
Steps:
- Look at all the volume groups in your RHEL host and check to see which one has enough space:
$ sudo vgs
VG   #PV #LV #SN Attr   VSize   VFree
slow   2  12   0 wz--n-   2.72t  1.59t
The above shows that the volume group “slow” has almost 1.6 TiB of free space and can easily accommodate 80 Gib disk space.
- Create the logical volume with 25 Gib of disk space:
$ sudo lvcreate -n win10-target -p rw -L 25G slow - You need to open up the VNC port so that you can access the VM and interact with the Windows installation process through the firewall. In order to open up the VNC ports, use the following commands:
$ sudo firewall-cmd --permanent --add-port=5901/tcp
$ sudo firewall-cmd --reload
This will open up ports 5901 so that you can connect to these ports on the remote host using the VNC client running on your local desktop.
- Start the installation process by starting the guest OS:
# virt-install \
--name=win10-target \
--os-variant win10 \
--network=default \
--cdrom=/location/of/the/install/iso/win10-server.iso \
—-disk=/dev/slow/win10-target \
—-memory 2048 --vcpus 2 \
—-serial stdio \
—-graphics vnc,port=5901,listen=<ip of local machine> \
—-cpu host
- Open the VNC client and point to port 5901 of the remote host. Install Windows like you normally would. It is preferable to disable updates so that Windows updates do not interfere with the debug process. Disable all unnecessary widgets and items.
If the target is a relatively newer version of Windows, like Windows 10 22H2 or Windows 11, there is nothing else that needs to be done. For older versions of Windows like Windows XP, Windows Vista, Windows 7/8 or some early versions of Windows 10*, a checked/debug build might be needed (see Introduction to AMLI debugger) to get debugging capability from acpi.sys.
You do not need to install WDK/DDK in the target VM if you are using a relatively new version of Windows that does not require checked build. Without the checked/debug build for older Windows releases, you will not be able to get the debug symbols while debugging. For example, we got a message for the Windows XP sp1 target similar to that shown in Figure 5.
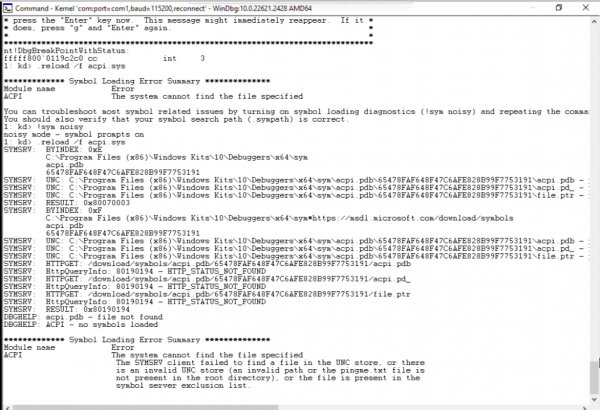
Figure 5: Symbol loading error. Error could be worked around by replacing
acpi.syswith a debug version from checked build.

- Start the target Windows VM after adding the same unix domain socket as its serial port except this time as a client. You can do that using the following XML in the VM’s domain definition:
<serial type='unix'>
      <source mode='connect' path='/tmp/servercon'/>
      <target type='isa-serial' port='0'>
        <model name='isa-serial'/>
      </target>
</serial>
<console type='unix'>
      <source mode='bind' path='/tmp/servercon'/>
      <target type='serial' port='0'/>
</console>
Notice that this time, the mode is
connect, notbind, and the path of the socket file is the same as that of the server.
- For Windows Vista and later (WDK 7.1), once the VM starts, open up a command prompt window as Administrator. Run the following commands (BCDEdit /dbgsettings):
$ bcdedit /debug on
$ bcdedit /dbgsettings serial debugport:1 baudrate:115200
The baud rate must be the same on both debug server and the target. The recommended value is
115200. This turns on the debug mode for the target.
For Windows XP, the above step will not work and you need to edit the file “boot.ini”** and add/debug /debugport=com1 /baudrate=115200 to the boot options. Instructions for how to do that can be found in Kernel Debugging with WinDbg.
- After the above steps, reboot the target VM. The debugger on the debug server should now attach to the target.
- Use Ctrl-Break to break into the debugger as soon as possible as the target boots (or use the menu option Debug → Break).

Debugging ACPI using WinDbg
Microsoft has extensive documentation for performing ACPI debugging. Once you break into the debugger, run the following commands:
bp !ACPI!DriverEntry: This sets the breakpoint at ACPI driver entry. After this, let the debugee/target run by typingg. When the target enters ACPI driver code, it will break into the debugger. Once it breaks, type the following- !
amli set dbgbrkon verboseon traceon errbrkon spewon: A detailed description of what these commands do is available in amli set command . All the above set various options for the aml debugger. For example, thedbgbrkonwill enable breaking into the aml debugger. - Other useful commands include
!fadtto dump FADT table,!acpicachedisplays the ACPI tables cached in memory, etc. !acpitable <table name> will dump the corresponding table. - For other available extensions, please see Other ACPI Debugging Extensions.
AML debugging examples shows some very good examples of ACPI debugging scenarios. Once you are done with debugging, you may go to Edit → Write Window Text to file to write the contents of the debugger window to a text file for post analysis.
Notes
* The oldest retail version of Windows we have tried is Windows 10 version 1511 where we were able to get debug symbols after reloading acpi.sys without using a checked/debug build even though per Introduction to AMLI debugger, for Windows versions older than 1803, checked builds might be needed.
** Other than directly editing c:\boot.ini, one can also use the Windows GUI. On the desktop, right-click the My computer icon → Properties → Advanced. Under Startup and Recovery, click Settings, and then under System Startup, click Edit.
*** You may need a Visual Studio subscription if you want to download the checked build/WDK/DDK, but not always. For example, you can download the WDK 7.1.0 for Windows 7, Windows Vista, Windows XP, Windows Server 2008 R2, Windows Server 2008, and Windows Server 2003 from WDK 7.1.
References
- Connect to a kernel-mode WinDbg session
- Setting Up Kernel-Mode Debugging of a Virtual Machine Manually using a Virtual COM Port
- Choosing the 32-bit or 64-bit Debugging Tools
- Checked and Free Build Differences
- Basic AML Debugging
- Subscriptions
- Getting started with virtualization (RHEL 8)
- Enabling virtualization (RHEL 9)
- !amli set command
- AML debugging examples
- Other ACPI Debugging Extensions
- Introduction to AMLI debugger
- Kernel Debugging with WinDbg
- BCDEdit /dbgsettings
- BCDEdit Commands for Boot Environment
- Visual Studio Subscriptions
- WDK 7.1
