

Keeping your systems safe and secure is something that every organization and every individual should be concerned about, and there are many aspects to that topic. One of them is to harden systems according to a standard and also assess the systems against these standards. OpenSCAP is an open standard that lets you achieve exactly that. You can use it to check Linux-based systems as well as Red Hat OpenShift clusters against industry standards such as CIS, ACSC E8, or NIST.
The basics of creating a compliance report
The simplest way to run evaluate the compliance status of a system is to use the oscap tool and run it against a profile such as ACSC E8. Here an example on a Red Hat Enterprise Linux 9 system:
$ oscap xccdf eval --profile xccdf_org.ssgproject.content_profile_e8 --results-arf arf.xml /usr/share/xml/scap/ssg/content/ssg-rhel9-ds.xml
With this command, the OpenSCAP scanner oscap runs the Essential 8 XCCDF checklist of the Australian Cyber Security Centre against the system, and writes the result into an XML file called arf.xml. It also prints out the result of each check.
You can also obtain a nicely formated HTML format of this output by running the following command:
$ oscap xccdf generate report --output report.html arf.xml
This approach works very well for single systems, but it does not scale and it does not provide an overview of the compliance state of a whole fleet of systems.
OpenShift Compliance Operator
The OpenShift Compliance Operator is an operator-based approach to OpenSCAP. It can be used do assess compliance of a whole OpenShift cluster. Under the hood, the OpenShift Compliance Operator runs the oscap xccdf eval command against the nodes of the OpenShift Cluster, which produces several result files. The overall results of the scans can be obtained by inspecting the corresponding Kubernetes objects such as ComplianceScan and ComplianceSuite.
Using these basic mechanisms, it is fairly easy to obtain an overview of the OpenShift cluster state, but it is still quite hard to dive deeper into the scan results, since they are only available in raw form and as an overall scan result.
Introducing SCAPinoculars
The aim of the SCAPinoculars project is to be able to easily inspect a bunch of OpenSCAP raw result files. It is written in Go, and designed to be able to run in a container, so it can be easily deployed on OpenShift or any other container environment. SCAPinoculars scans a given directory structure for raw OpenSCAP results in the ARF format and renders the corresponding HTML report using the oscap xccdf generate report command. An index page groups the reports per target and profile. It also gives a first indicator of the compliance score, showing the number of passed vs. the number of failed checks, as shown in Figure 1.
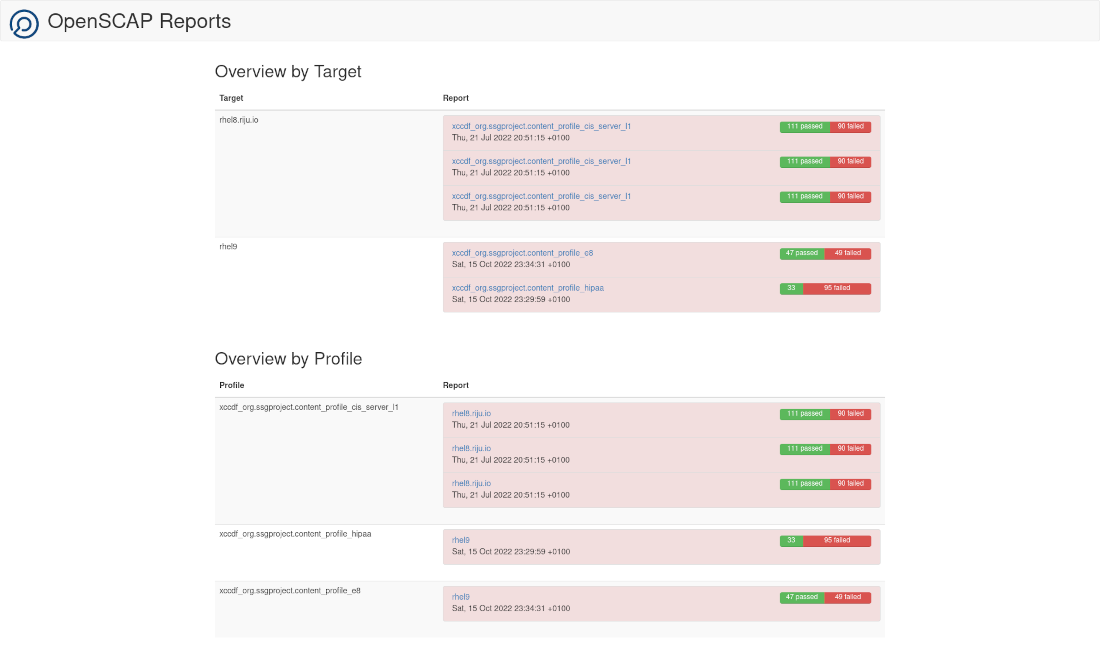
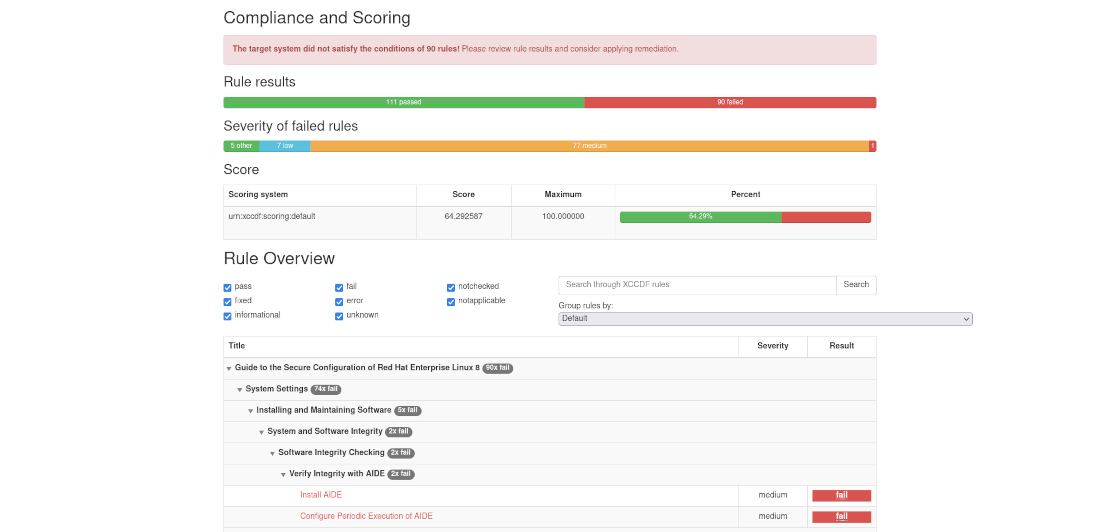
For each report there is a link on the overview page, allowing to drill down into the detailed OpenSCAP report (Figure 2).
Prometheus metrics
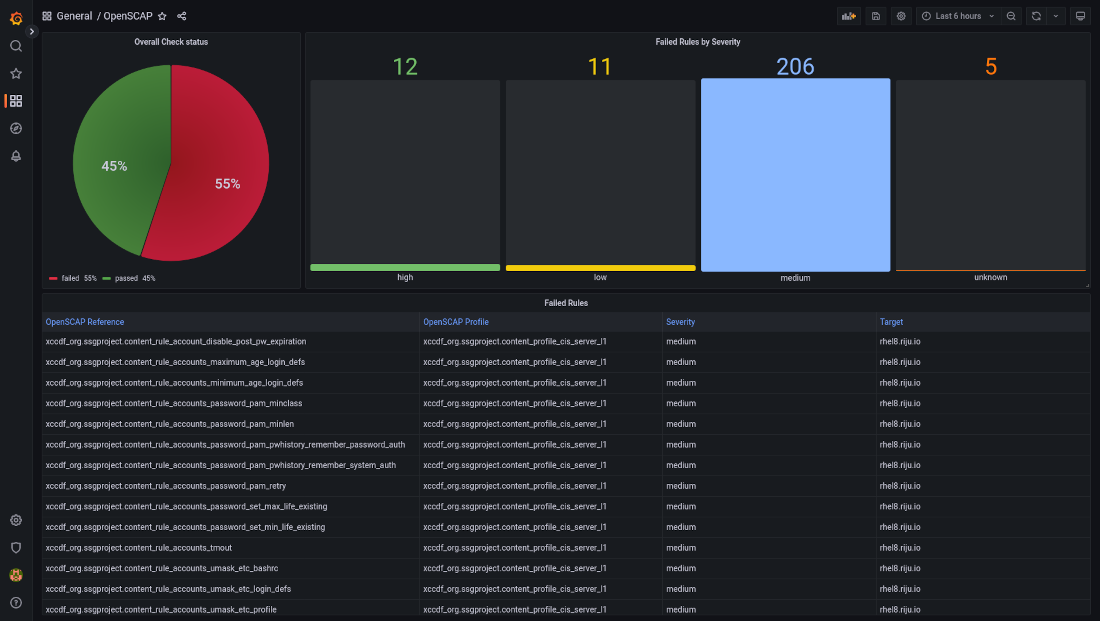
Another feature of SCAPinoculars is the ability to generate Prometheus metrics. The OpenShift Compliance Operator exposes some very basic metrics that indicate whether a profile has been evaluated as compliant or not, however there is no indicator how many rules have failed. There is also no indicator regarding the severity of the failed rules.
SCAPinoculars can ingest the result files, and generate metrics based on the results. Using PromQL, it is then possible to aggregate these metrics. SCAPinoculars also ships a very simple Grafana dashboard (Figure 3).
Conclusion
SCAPinoculars is a simple and lightweight tool to inspect OpenSCAP compliance reports in a browser. Also, it exposes some useful metrics, which can be used to visualize compliance check results and trends in a tool like Grafana. It builds on existing tools and standards and adds functionality where necessary.
