

Welcome back to our series on using serverless functions on Red Hat OpenShift. The previous article introduced you to how logging works in Node.js and how to customize what is logged in a Node.js function application. Now, we'll take a look at how to debug Node.js function-based applications. Because debugging is a longer topic, we'll cover it in two parts. This article walks through how to set up and debug function applications locally with Visual Studio Code (VS Code). The next article will show you how to connect and debug function applications running in a container on a cluster.
Note: For an introduction to logging function-based applications, see Node.js serverless functions on Red Hat OpenShift, Part 1: Logging. For an overview of Red Hat OpenShift Serverless Functions, see Create your first serverless function with Red Hat OpenShift Serverless Functions.
Prerequisites
To follow along with this article, you will need to install Node.js and download the example application from GitHub. We'll also use VS Code for its easy-to-use built-in debugger.
As with the previous article, we scaffolded this function application with the kn func command-line interface (CLI) tool. If you are not already familiar with it, you can learn more by reading Create your first serverless function with Red Hat OpenShift Serverless Functions.
Setting up the function application in Visual Studio Code
Use Git to clone the example repository and then open it up in VS Code. We can see that this Node.js function application is just like any other Node.js application, with an index.js file where the main function logic is located.
Before we continue, let's put a breakpoint right around line 30, which is inside the invoke function (see Figure 1).
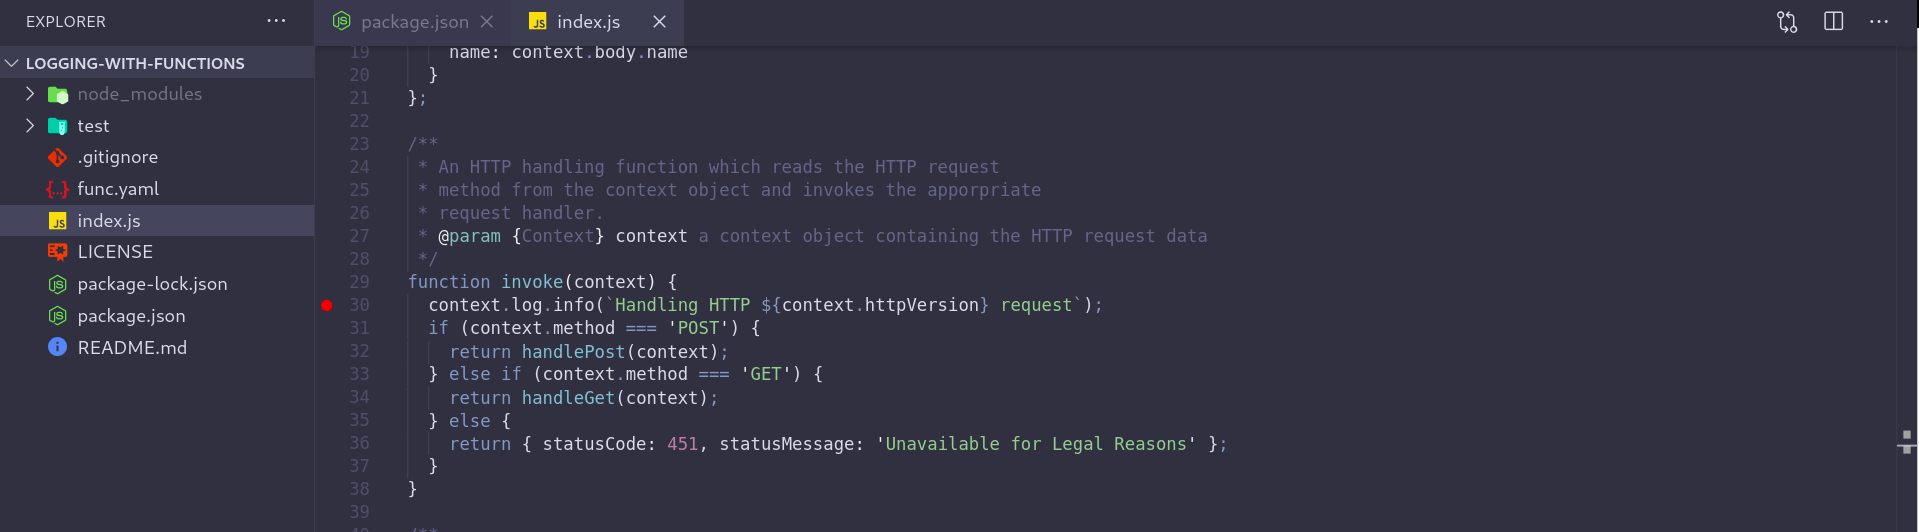
We are setting the breakpoint here because we want to be able to halt the execution of the function when it is called, and the invoke function is the entry point generated by the kn func CLI tool. This allows us to step through the code and inspect the different variables the function provides as the function executes.
Let's take a look at the package.json file. We can see in the following code example that there are three npm scripts generated by the kn func CLI tool: one for running, another for testing, and another one for debugging. This last script is the one we are interested in.
"scripts": {

    "test": "node test/unit.js && node test/integration.js",

    "local": "faas-js-runtime ./index.js",

    "debug": "nodemon --inspect ./node_modules/faas-js-runtime/bin/cli.js ./index.js"

  }
There are a few things to note about this debug script. First, it uses Nodemon to start the Node.js process. Nodemon will also detect any code changes and restart the Node.js process when the changes are saved.
The second is the --inspect flag. This allows us to stop the Node.js process at any breakpoints we set. At the moment, we've only set one.
The last is that the script is called with the faas-js-runtime CLI. This is a module that provides a Node.js framework for executing a function. The function listens for incoming HTTP requests at localhost:8080. The incoming request can be a CloudEvent or just a simple HTTP GET request. To learn more about the faas-js-runtime, check out the project on GitHub.
Debugging the function application
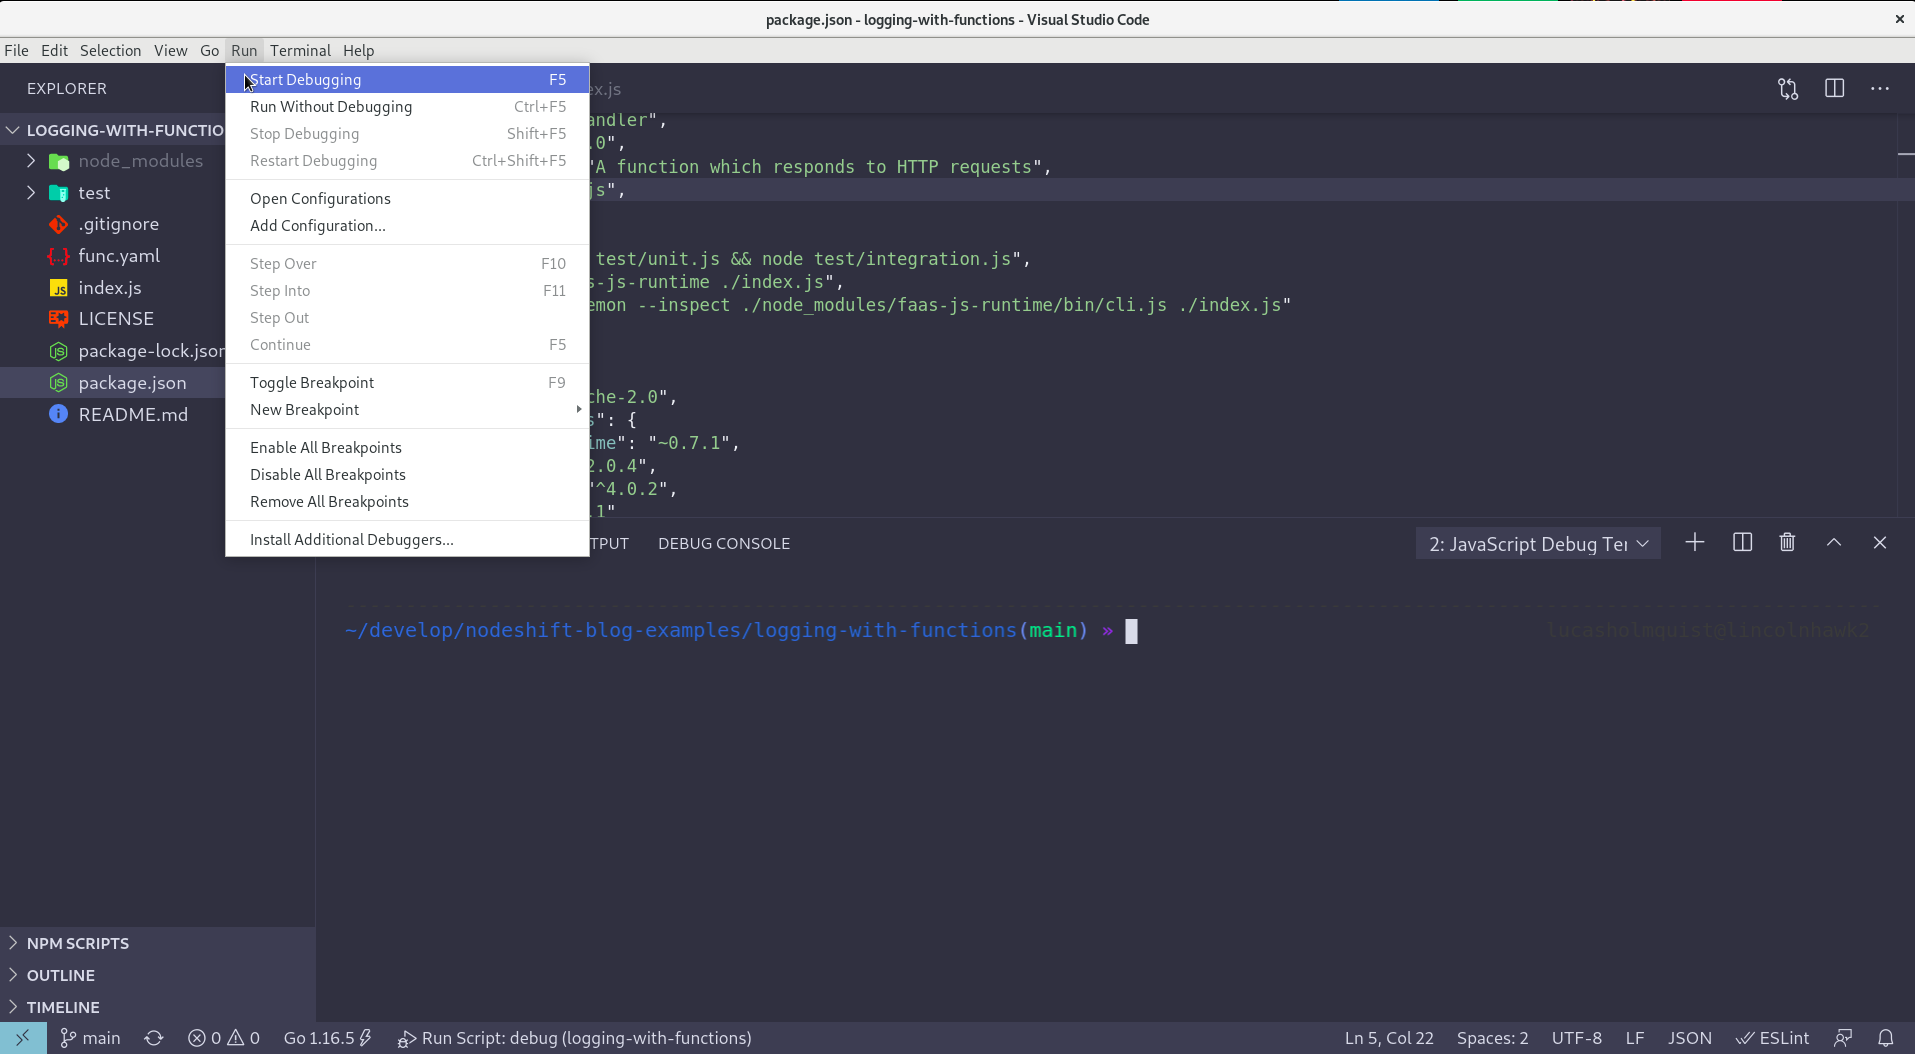
Starting the debugging process is fairly simple. Select Start Debugging from the Run menu, as shown in Figure 2.
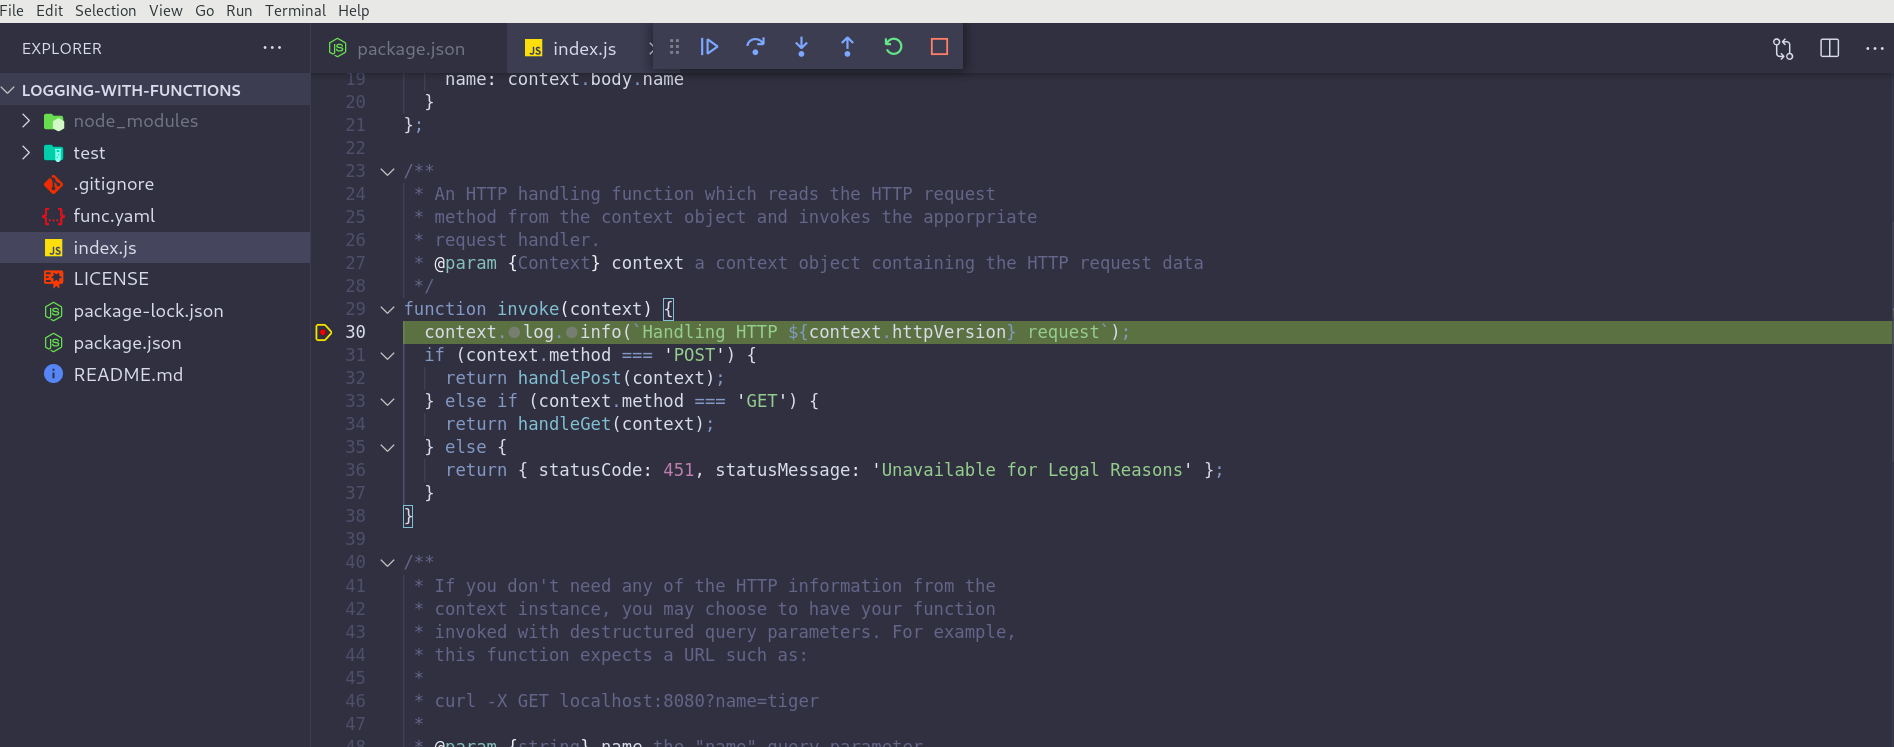
This initializes the Node.js process using the --inspect flag and Nodemon. Once the process starts, your function runs at http://localhost:8080. Navigating to this URL should activate the breakpoint that we set earlier (see Figure 3).
From here, we can inspect any of the variables that are available to us. Functions are invoked with a context object, which can be inspected easily using VS Code's variable inspector on the left-hand side of the interface (as shown in Figure 4). This object provides access to the incoming request information. You can get the HTTP request method, any query strings sent with the request, the headers, the HTTP version, or the request body. If the incoming request is a CloudEvent, the CloudEvent itself will also be found on the context object.
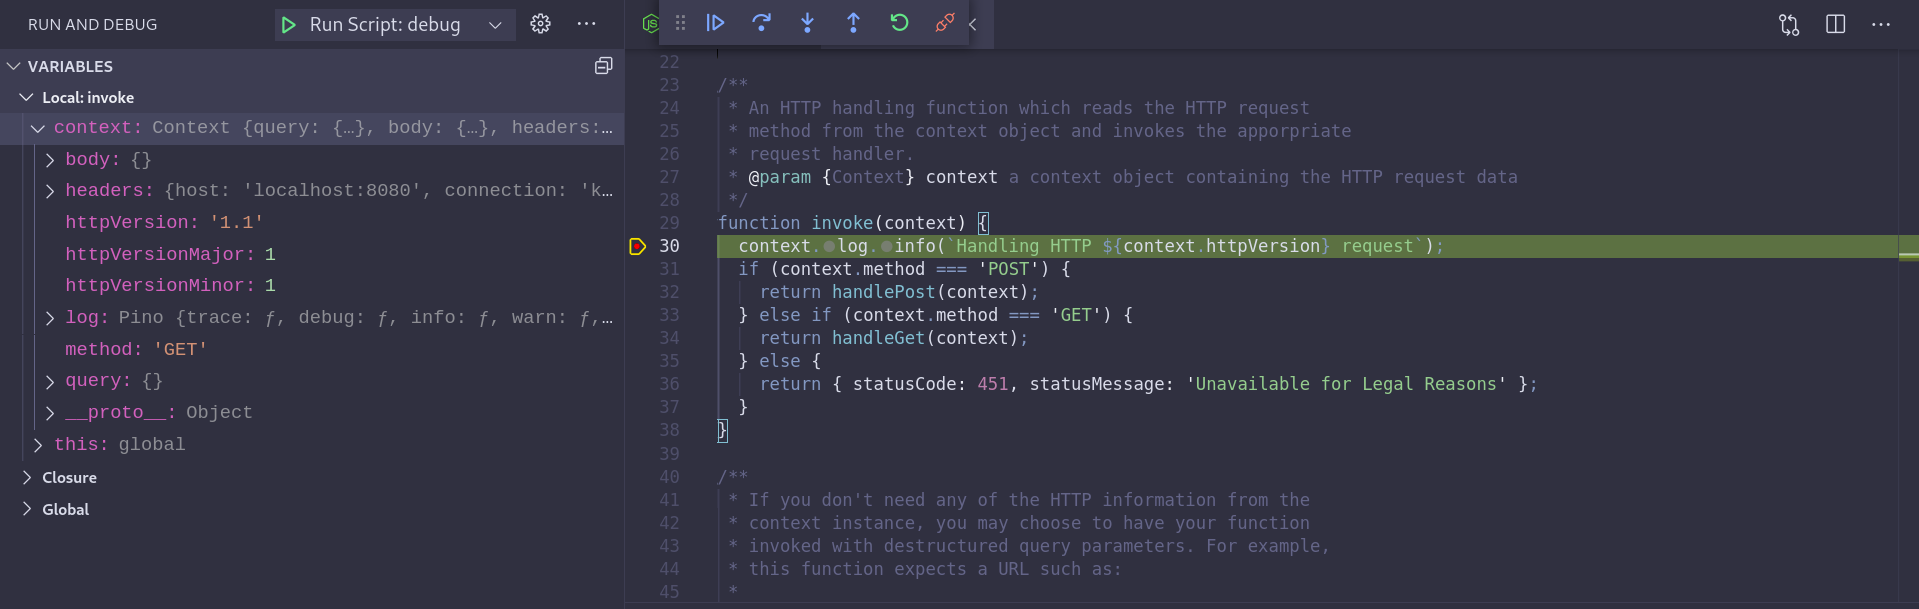
The request is a simple GET request. We can see from the variable inspector that it has no body or query params. As with most debugging tools, you can perform many debugging functions like stepping into and over a method, as well as just telling the process to continue executing.
Next, let's send a request to the function with a body. You can use this curl command:
curl -X POST -d '{"hello": "world"}' -H'Content-type: application/json' http://localhost:8080
When the process stops this time, we can see that there is some data in the context.body:
{
  context: {
    body: {
      hello: “name”
    }
  }
}
If the request was sent as a CloudEvent, this will help you easily inspect the request headers to learn more about it:
curl -X POST -d '{"hello": "world"}' \
  -H'Content-type: application/json' \
  -H'Ce-id: 1' \
  -H'Ce-source: cloud-event-example' \
  -H'Ce-type: dev.knative.example' \
  -H'Ce-specversion: 0.2' \
  http://localhost:8080
To learn more about this context object and the parameters it provides to the function developer, check here. To learn more about CloudEvents, check here.
Conclusion
This article introduced you to debugging a Node.js serverless function application locally while you develop the function application. Stay tuned for the next part of this series, where we'll look at how to debug the function application while running inside a container on a Kubernetes cluster such as Red Hat OpenShift.
While you wait, you can read about the latest on OpenShift Serverless Functions. To learn more about what Red Hat is up to on the Node.js front, check out our Node.js topic page.
Last updated: September 19, 2023