
The Istio service mesh is a powerful tool for building a service mesh. If you don't know about Istio yet, have a look at the Introduction to Istio series of articles or download the ebook Introducing Istio Service Mesh for Microservices.
The power of Istio comes with the cost of some complexity at configuration and runtime. To help this, the Kiali project provides observability of the mesh and the services in the mesh. Kiali visualizes the mesh with its services and workloads. It indicates the health of the mesh and shows hints about applied configuration options. You can then drill in on individual services or settings to view details.
This post describes how to use Kiali to observe what the microservices in your Istio service mesh are doing, validate the Istio configuration, and see any issues.
Visualizing an Istio service mesh
Here's a Kiali graph view of an Istio service mesh:
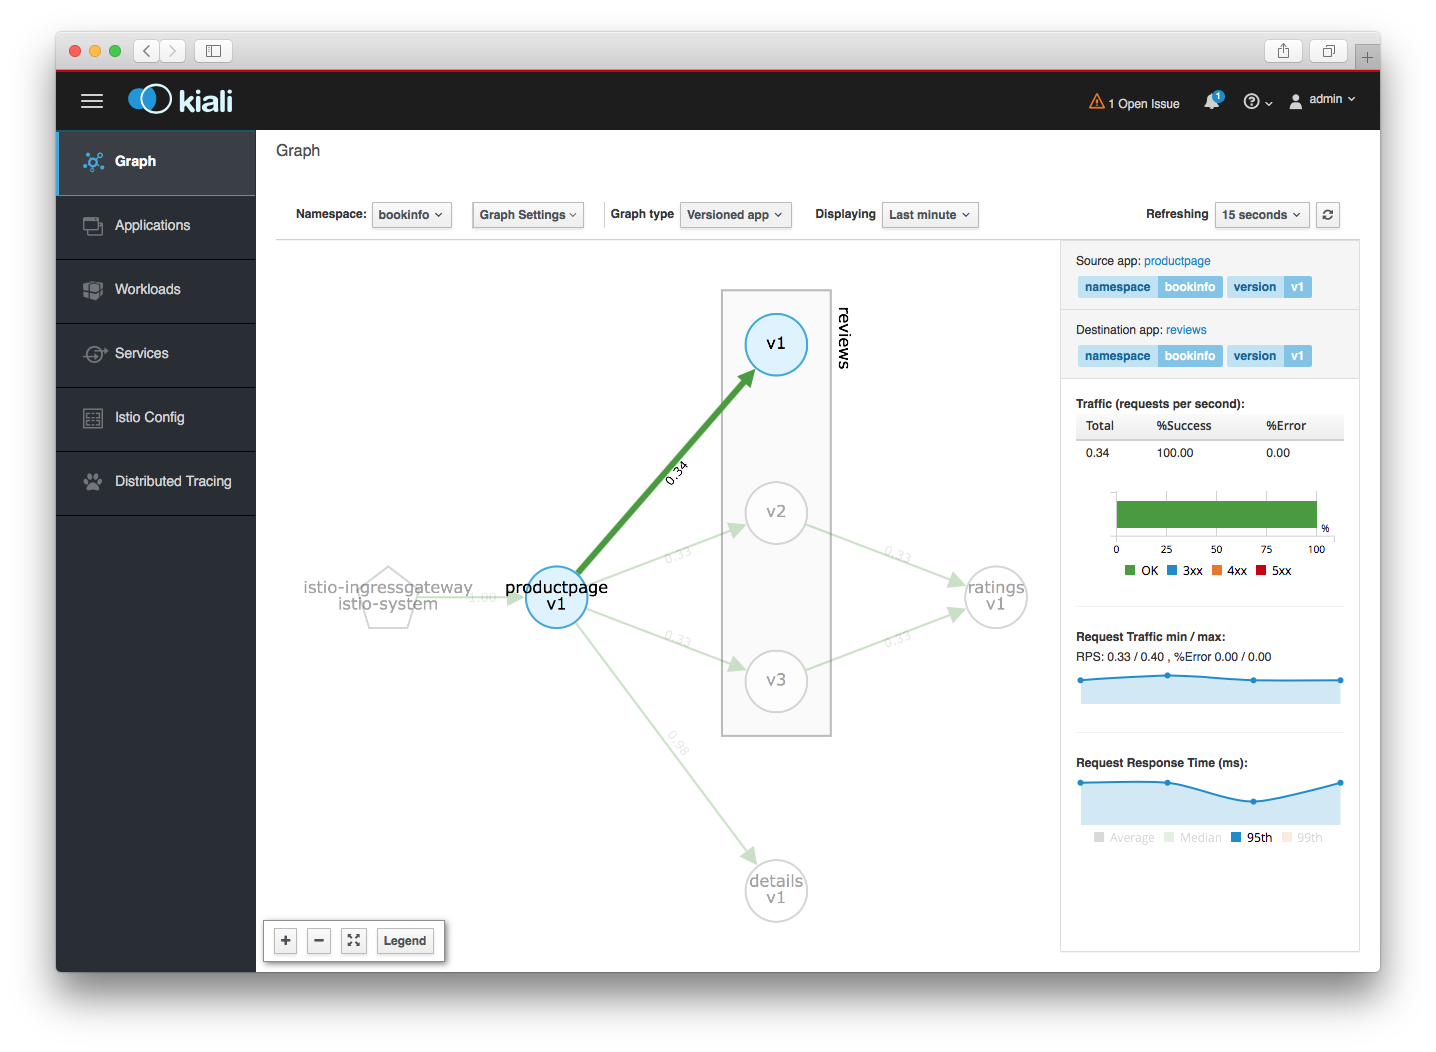
In the above screenshot, you can see the mesh for the Istio Bookinfo demo. The reviews application consists of three versioned workloads, and two of the workloads talk to the ratings application.
The edge between the productpage and reviews:v1 is highlighted (by clicking on it), which shows on the right side more detailed statistics about the request traffic and response time.
Visualizing issues
In the screenshot below you can see that there is something bad going on in the mesh. Parts of the graph show red and in the right sidebar, you can see that around one-third of the requests end up in an error.
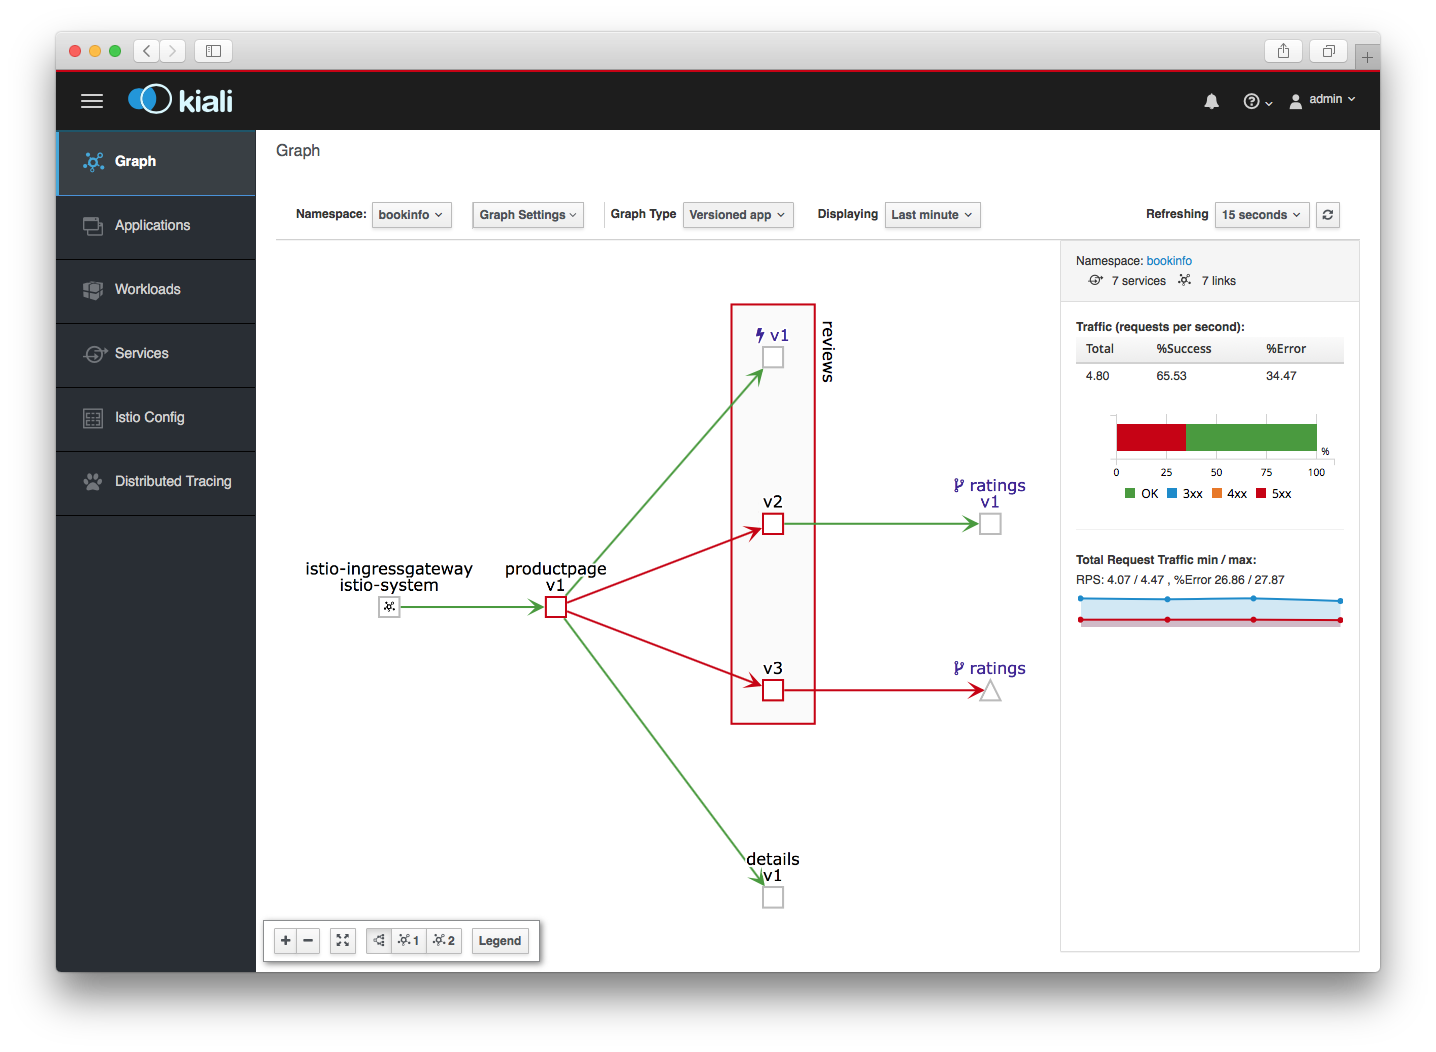
When you look closer at ratings:v1 and the ratings triangle, you will see a y-shaped icon. This icon indicates that the ratings service has an Istio VirtualService applied. From reviews:v2, requests reach the ratings:v1 workload, but from reviews:v3, the requests are failing.
Clicking on the triangle icon for the ratings service and then clicking the link in the sidebar leads to the definition of the service. There, you can see that a virtual service is installed, which injects faults into the data stream. The Kiali screenshot below shows the details for a virtual service:
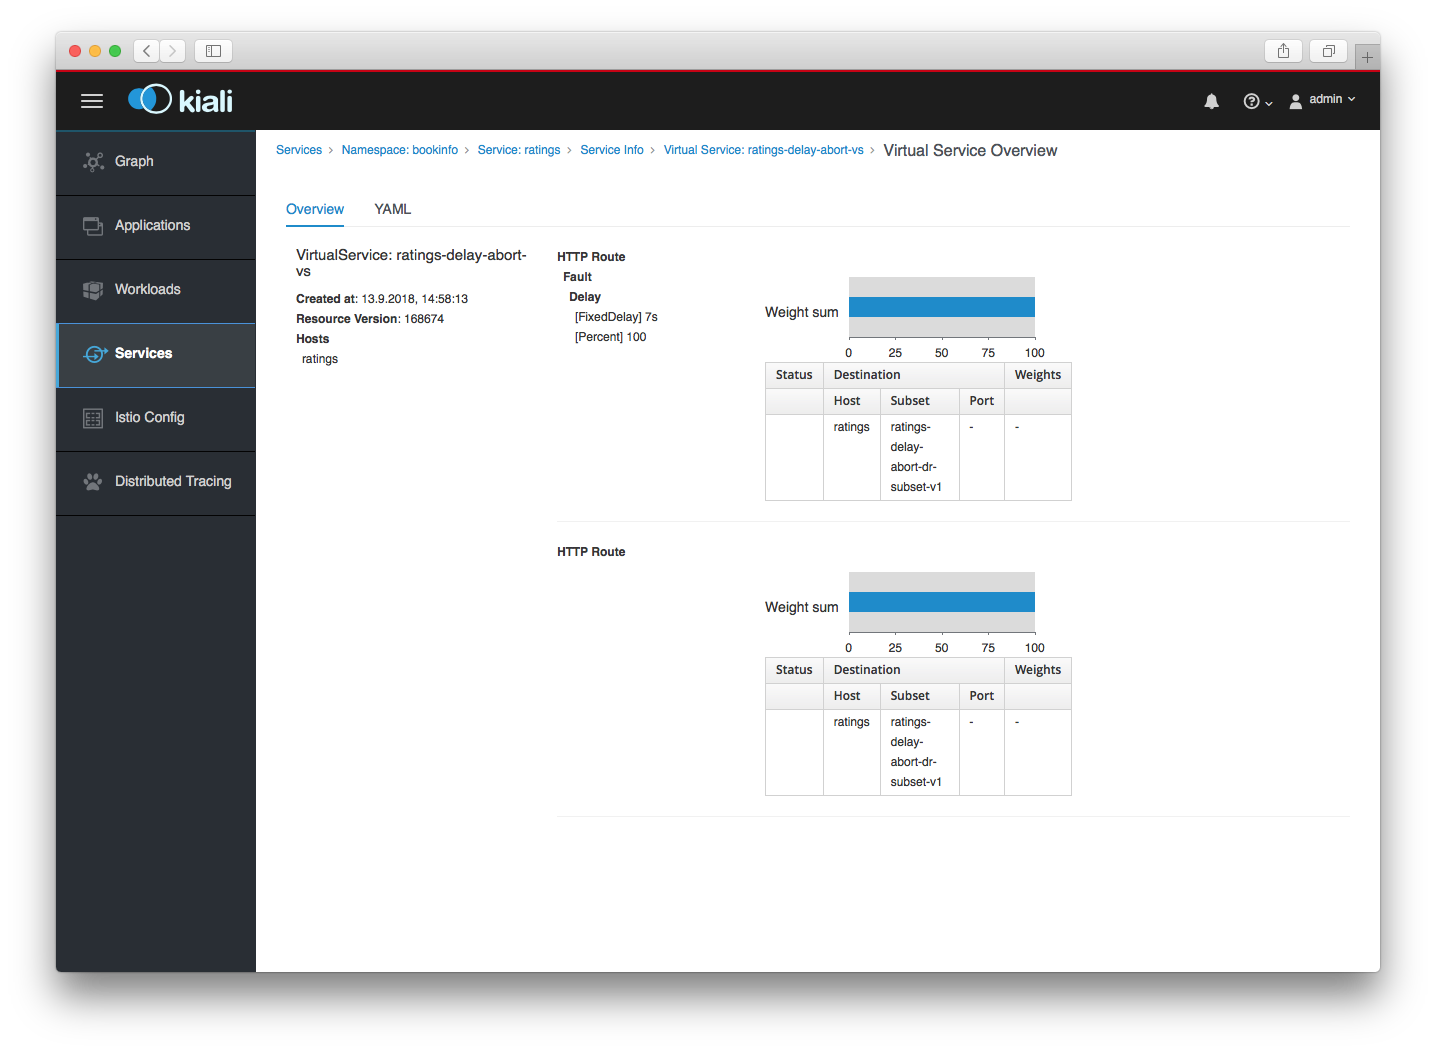
Kiali can also validate the Istio configuration. For example, Kiali shows a flag if the weight sum of the above HTTP routes does not add up to 100%.
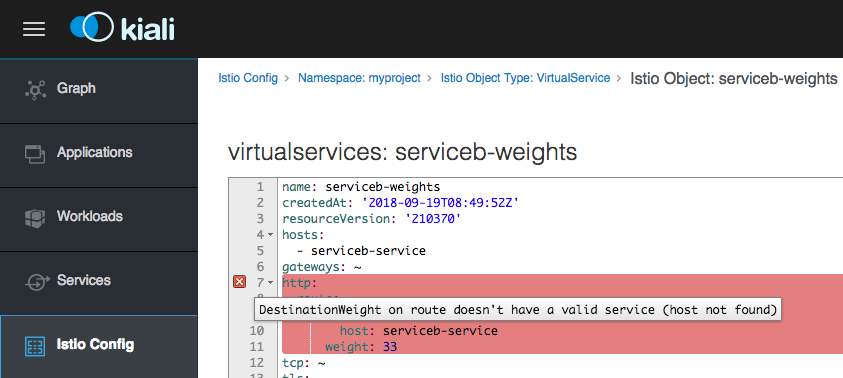
Or, Kiali can flag when there is an issue with a configuration object. The details screen then shows the issue:
Getting started with Kiali
The Kiali documentation has a page on getting started in OpenShift or plain Kubernetes. If you install upstream Istio, you can also choose to install Kiali with it. Have a look at the configuration options for Helm or customization with Ansible.
Logging in to Kiali (for now) is done using admin/admin.
Contributing to Kiali
Kiali is open source and released under the Apache V2.0 license. The source code lives on GitHub and any contributions are welcome. Please have a look at the contributing section of the README before you get started.
More information
The Kiali web page and GitHub pages are a good start. Kiali also has a blog and a YouTube channel that features the recording of the end-of-sprint demos. And last but not least, there is Twitter. :)
Last updated: September 6, 2022